Comparative Assessment of Physicochemical Parameters of Udaipur City, (Raj.) India-Juniper Publishers
Juniper Publishers- Open Access Journal of
Environmental Sciences & Natural Resources
Comparative Assessment of Physicochemical Parameters of Udaipur City, (Raj.) India
Authored by Chandra Shekar Kapoor
Abstract
Urbanization and Industrial activities lead the water contamination. It’s a serious problem now a day. Analysis of the water quality is essential to take a safety measures to protect & preserve the natural ecosystem. As a part of this study, Assessment of the water quality was carried out for different lakes in the City of Udaipur. The present analysis is aimed to assess the physicochemical parameters of water in Udaipur City. For determining the present water quality status by statistical evaluation 35 different parameters have been considered Viz. pH, color, total dissolved solids, electrical conductivity, total alkalinity, total hardness, chromium, zinc, manganese, nickel, BOD, COD, fluoride, zinc etc. The study of physicochemical and biological characteristics of this water sample suggests the evaluation of water quality. The indices had been computed from Jan 2013 to Dec. 2015.
Keywords: Physicochemical Parameters; B.O.D; C.O.D; Drinking Water Standard; Water Quality; Coliform
Introduction
Water is the most crucial factor in shaping the land and regulating the climate. It is one of the most important compounds that profoundly influence life. Wetlands are probably the earth’s foremost freshwater resources that provide food and habitat for numerous aquatic life including threatened and endangered species. Therefore conservation of wetlands is pretty essential as wetlands are one of the most threatened habitats in the world. The most important step for conservation of wetlands is to maintain a proper water quality. The water quality is directly related to the health of the water body hence proper management of water quality of the aquatic environment is very much crucial. Analysis of the British Columbia water quality index for watershed managers: a case study of two small watersheds [1]. The application of water quality indices and dissolved oxygen as indicators for river water classification and urban impact assessment [2]. Some of the most recent work on water quality of various aquatic environments. Assessment of bacterial indicators and physicochemical parameters to investigate pollution status of Gangetic river system of Uttarakhand, India [3]. DO-BOD modeling of River Yamuna for the national capital territory of India using stream II, a 2D water quality model [4]. Comparative analysis of regional water quality in Canada using the water quality index [5]. Physicochemical and microbiological study of Tehri dam reservoir, Garhwal Himalaya [6]. Water quality analysis of River Yamuna using water quality index in the national capital territory, India [7]. The impact of pharmaceutical industry treated effluents on the water quality of river Uppanar, south-east coast of India: A case study [8]. Seasonal variations in Physico-chemical characteristics of Rudra sagar wetland- a Ramsar site, Tripura, India [9].
Material and Methods
Study area
The city of Udaipur (state Rajasthan, India) known as ‘city of lakes’ is situated about 600 m above the mean sea level and is located among the lush green hills of Aravali range between 24°35’ N latitude and 73°42’ E longitude. There are three major lakes around Udaipur and within, e.g., Fateh Sagar, Udai Sagar and Pichhola. The city population is around 0.65 million and It has a distinctly tropical climate with marked monsoonal effect. The climate of Udaipur can be divided into three distinct seasons, i.e., summer (Mar-Jun), rain (Jul-Oct) and winter (Nov-Feb). The average temperature ranges from 5°C in winter to maximum of 41°C in summers. The annual average rainfall ranges from 62.5 cm to 125 cm during normal monsoon regime. The climate is divided into three seasons, Summer(Apr-Jun), Rainy (Jul-Oct) and Winter (Jan-Feb). The present study was conducted on the Physico-chemical parameters of the Fateh Sagar, Udai Sagar and Pichhola lakes.
Methodology
The physicochemical parameter, water temperature was measured in situ by using hand mercury thermometer, pH was estimated by Digital pH –meter (Elico-120).Turbidity was measured by Water Analyzer, EM-61, Electrical conductivity was measured by conductivity meter. (Tanco EE-014 Series Digital Conductivity Meter), TDS was measured with the help of Digital TDS meter. Other parameters, i.e. Total Alkalinity, Dissolved Oxygen, Biological Oxygen Demand(BOD) and Chemical Oxygen Demand (COD), Chloride, Sulphate, Sodium, Calcium, Magnesium, Total Hardness, Phenolphthalein Alkalinity, Phosphate, Nitrite, Fluoride, Ammonical Nitrogen, Boron Dissolved, Potassium, Cyanide, Cadmium, Lead, Chromium, Zinc,Iron, Copper, Nickel,Total Kjeldahl Nitrogen. The analysis of Total Suspended solids, Total Dissolved Solids, Fixed Dissolved Solids, Fecal Coliform and Total Coliform of water performed as per the standard methods [10-12] in the laboratory.
Results
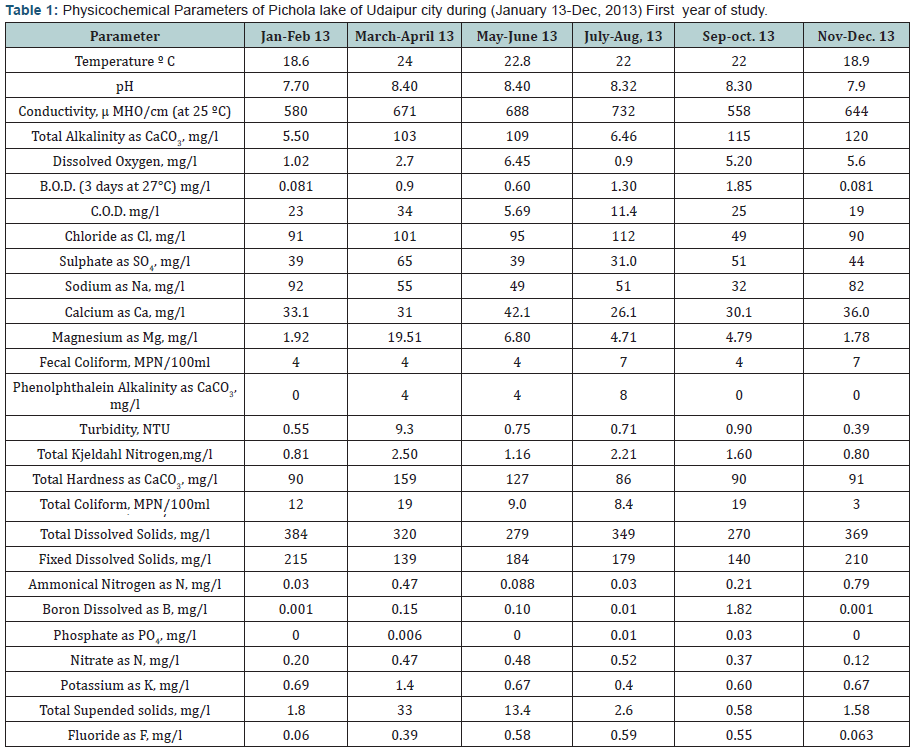
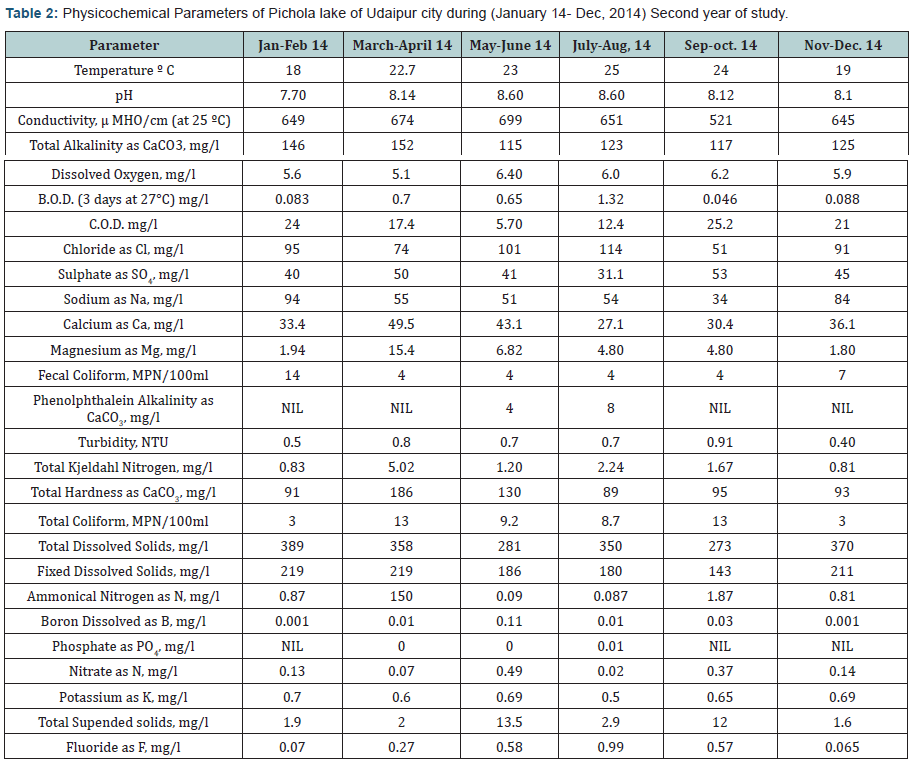
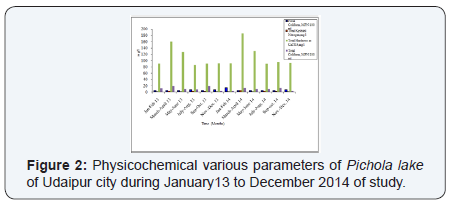
The results of investigations of various parameters of Pichola lake water quality were recorded for two years (Jan 2013 to Dec 2014). During this period (Tables 1 & 2), analysis of various physicochemical parameters of different physical sites of Udaipur city was performed and it was revealed that the range of temperature in different sampling sites was 18 degrees centigrade (minimum) to 25-degree centigrade (maximum). The pH was found 7.70 (minimum) in the month of Jan-Feb, 2013) and 8.60 (maximum) in the month of May-Jun, 2014. The amount of Conductivity in the different samples were minimum at 558 (Jul- Aug, 2014) and maximum 732 (Jul-Aug, 2013). The amount of Total Alkalinity recorded minimum at 5.50 mg/l and maximum 152 mg/l. The amount of Dissolved Oxygen recorded minimum as 0.9 mg/l in Jul-Aug, 2013 and maximum 6.45 mg/l in May- Jun, 2014. In the case of B.O.D. lowest value was recorded in the month Jan-Feb, 2013 at 0.081mg/l and highest in the month of Sep-Oct, 2013 at 1.85 mg/l. C.O.D. content in the water samples was recorded highest during Sep-Oct, 2013 (25 mg/l) and lowest during May-Jun, 2013 (5.69 mg/l). Similarly in the samples of Chloride, Sulphate recorded highest in the months of Jul-Aug, 2014 (114 mg/l) and in Mar-Apr, (65 mg/l), and minimum in the samples of Sep-Oct, 2013 (49 mg/l) and of Jul-Aug, 2013 (31.0 mg/l ). Sodium content was observed maximum in the months of Jan-Feb, 2014 (94 mg/l) and minimum in those of during Sep- Oct, 2013 (32 mg/l). ). The amount of Calcium and Magnesium was recorded higher in the months of and Mar-Apr, 2014 (49.5 mg/l; 19.51 mg/l) and lower in Jul-Aug, 2013 & Nov-Dec, 2014 (26.1 and 1.80 mg/l) in the sample of Pichola Lake respectively. Fecal Coliform content recorded maximum and minimum in the months of Nov-Dec, 2014, (7 MPN /100ml); Jan-Feb, 2013 (4 MPN /100ml). The amount Phenolphthalein Alkalinity as recorded of the different samples as maximum 8 mg/l Jul-Aug, 2014. The amount of Turbidity ranged between 0.39 and 9.3 NTU. Similarly, the amount of Total Kjeldahl Nitrogen was minimum at Nov-Dec, 2014, 0.80 mg/l and Jul-Aug, 2014 maximum 2.24 mg/l. The Total Hardness content was recorded highest during Mar- Apr, 2014 (186 mg/l) and lowest value (89 mg/l during Jul-Aug, 2014). Total Coliform content was higher during Mar-Apr,2013 (19 MPN/100ml), lower value 3 MPN/100ml Nov-Dec, 2014. Total Dissolved and Fixed Dissolved Solids recorded highest in the months of Jun-Feb, 2014 (389 mg/l & (219 mg/l), and minimum in the samples of Sep-Oct, 2013 (270 mg/l) and Mar- Apr, 2013 (139 mg/l). The lowest values of Ammonical Nitrogen were recorded during (Jan-Feb, 2013, 0.03 mg/l)and the highest values in Nov-Dec, 2014 (0.81mg/l).The amount of Boron Dissolved were recorded highest during Nov-Dec, 2013as 0.79 mg/l and lowest 0.001mg/l in Jan-Feb, 2014.The highest amount of Phosphate was recorded during the Sep-Oct, 2013 (0.03 mg/l) lowest 0.0 mg/l Nitrate was recorded highest during Mar-Apr, 2014 (0.07mg/l) and lowest during Jul-Aug, 2013(520). It was observed that the amount of Potassium in the water sample of Pichola lake was high in Jun-Feb, 2013 (0.69mg/l) and lower in Jul-Aug, 2013 (0.4 mg/l).Total Suspended solids were found high during Mar-Apr, 2013 in the sample water of lakes (33 mg/l) and minimum value in Jan-Feb,2013 (1.8 mg/l). Highest Fluoride content was recorded in (0.99 mg/l during Jul-Aug, 2014) and lowest in the sample of industrial area (0.06 mg/l during Jan- Feb, 2013). Pichola Lake and Fateh Sagar area were computed (Tables 3-8).
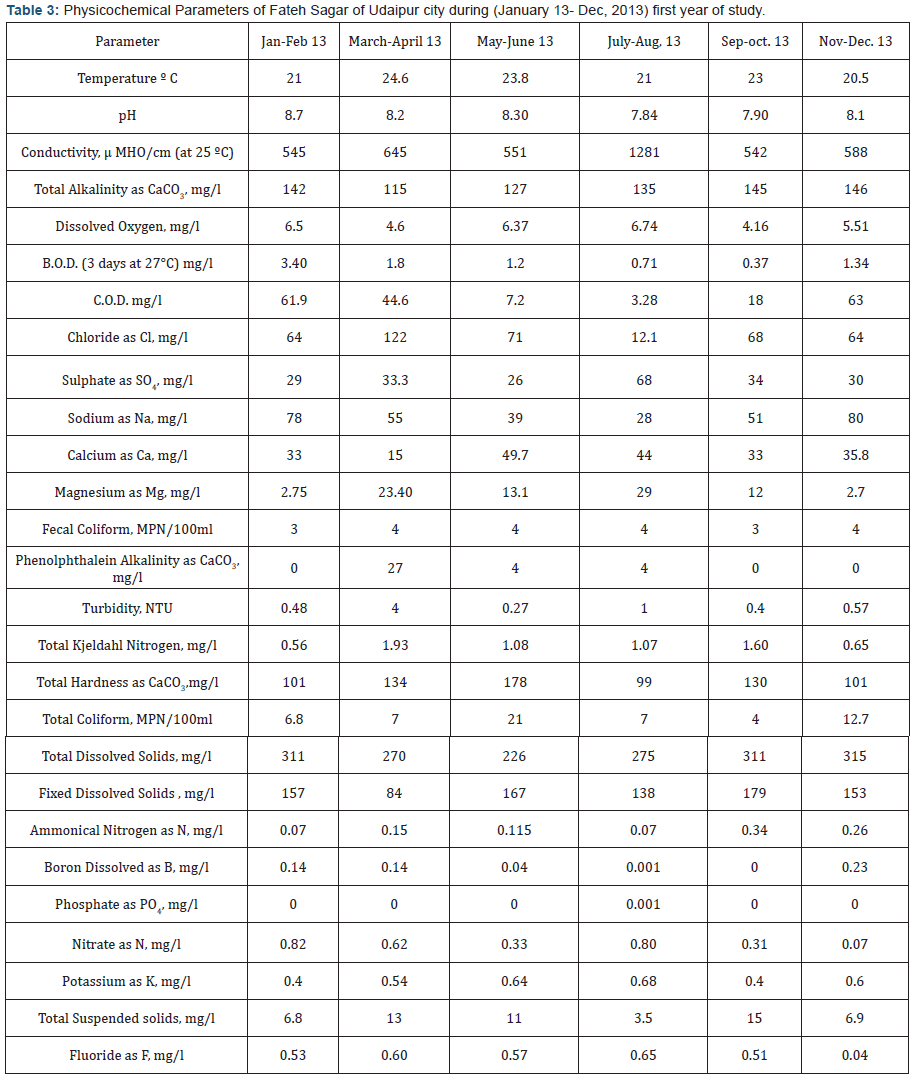
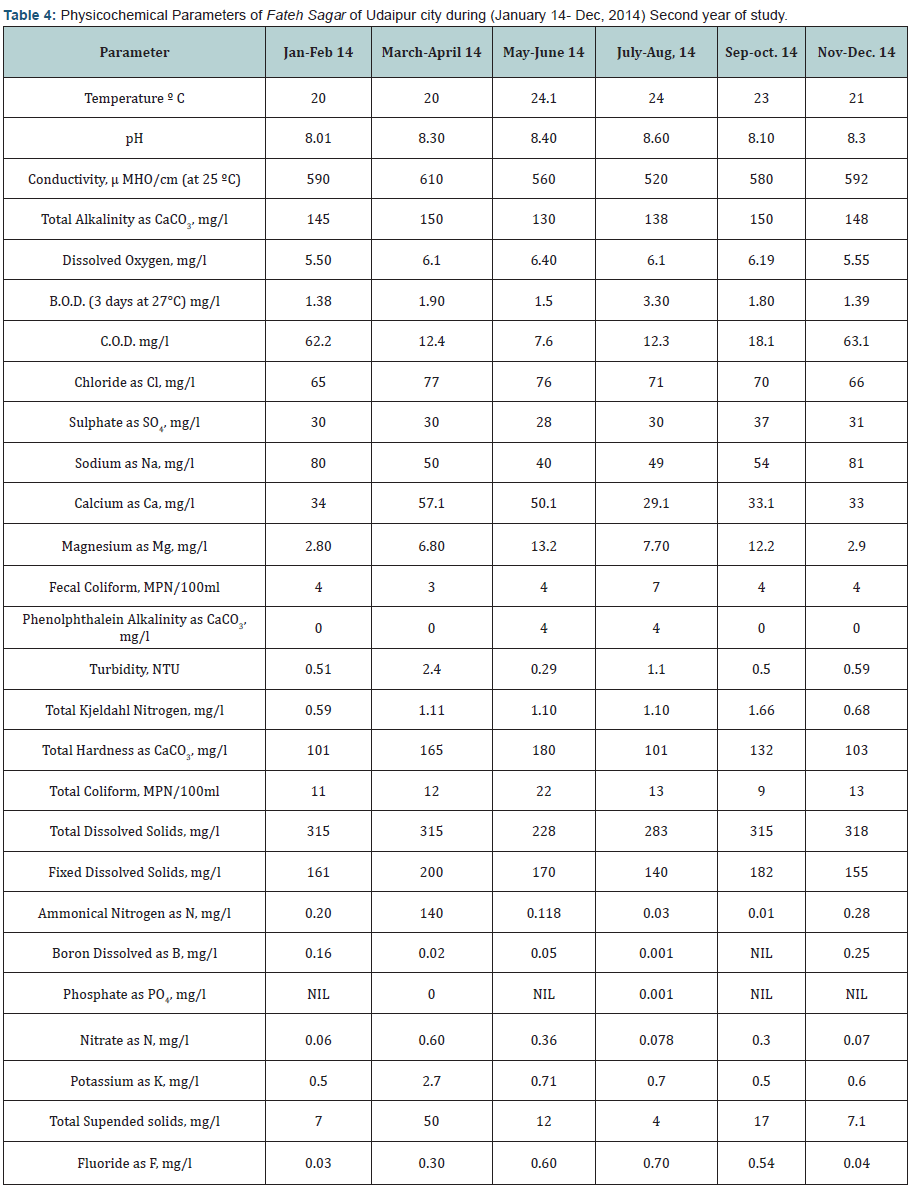
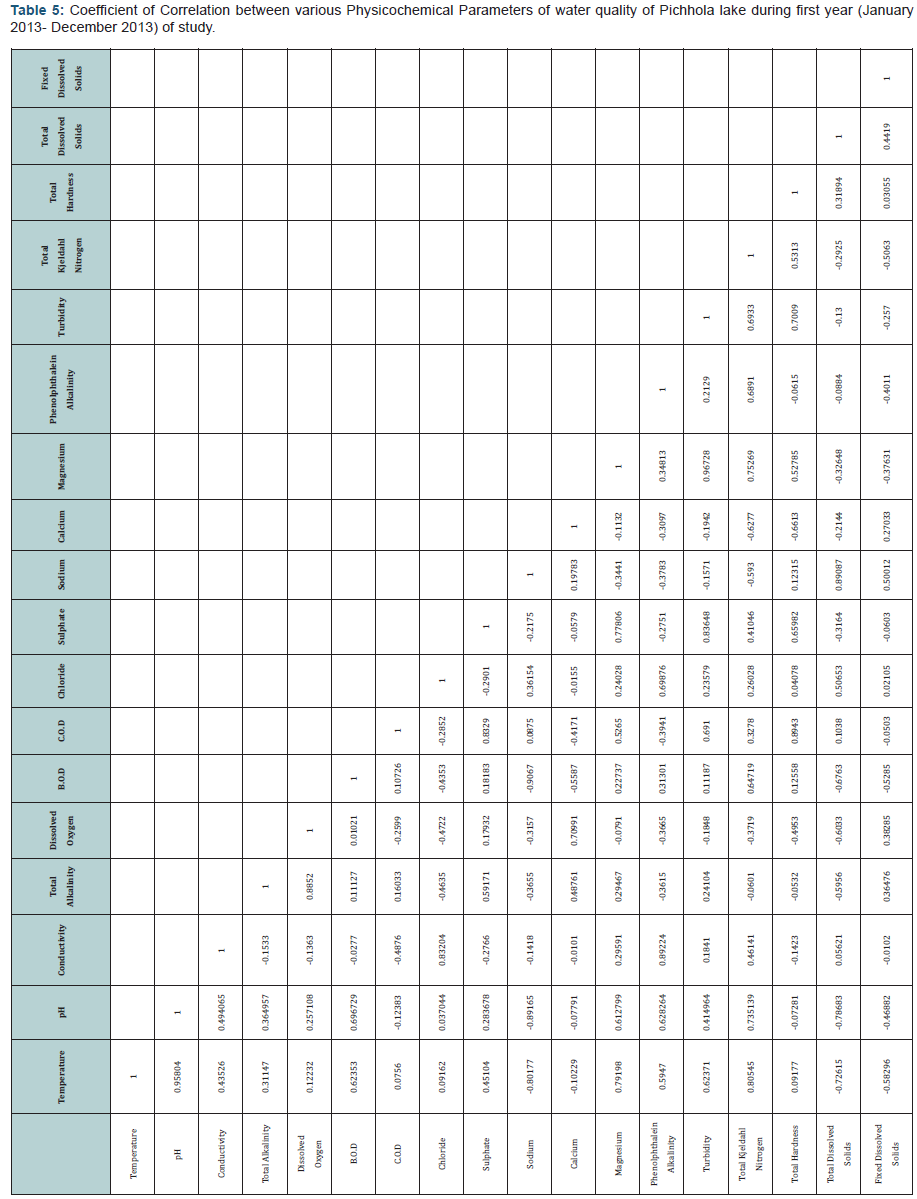
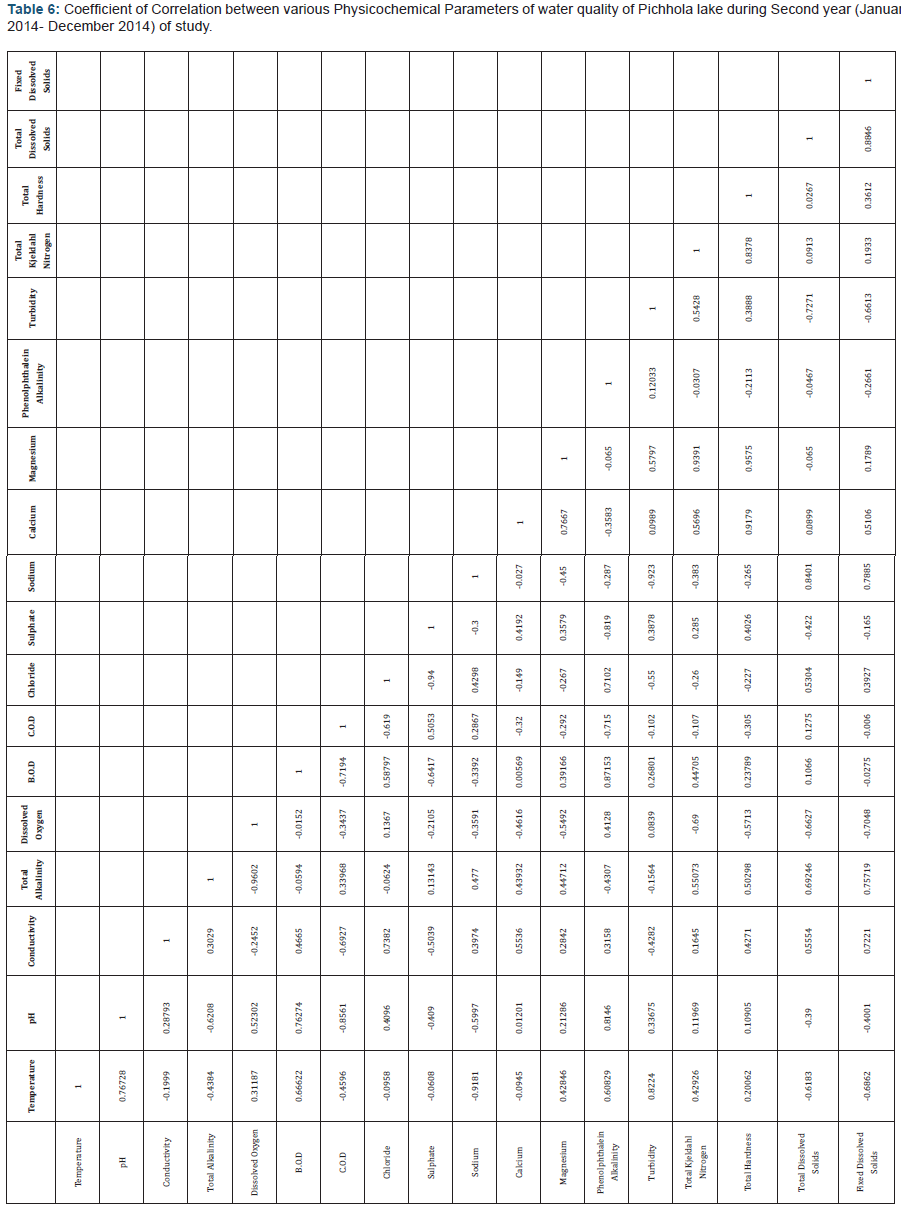
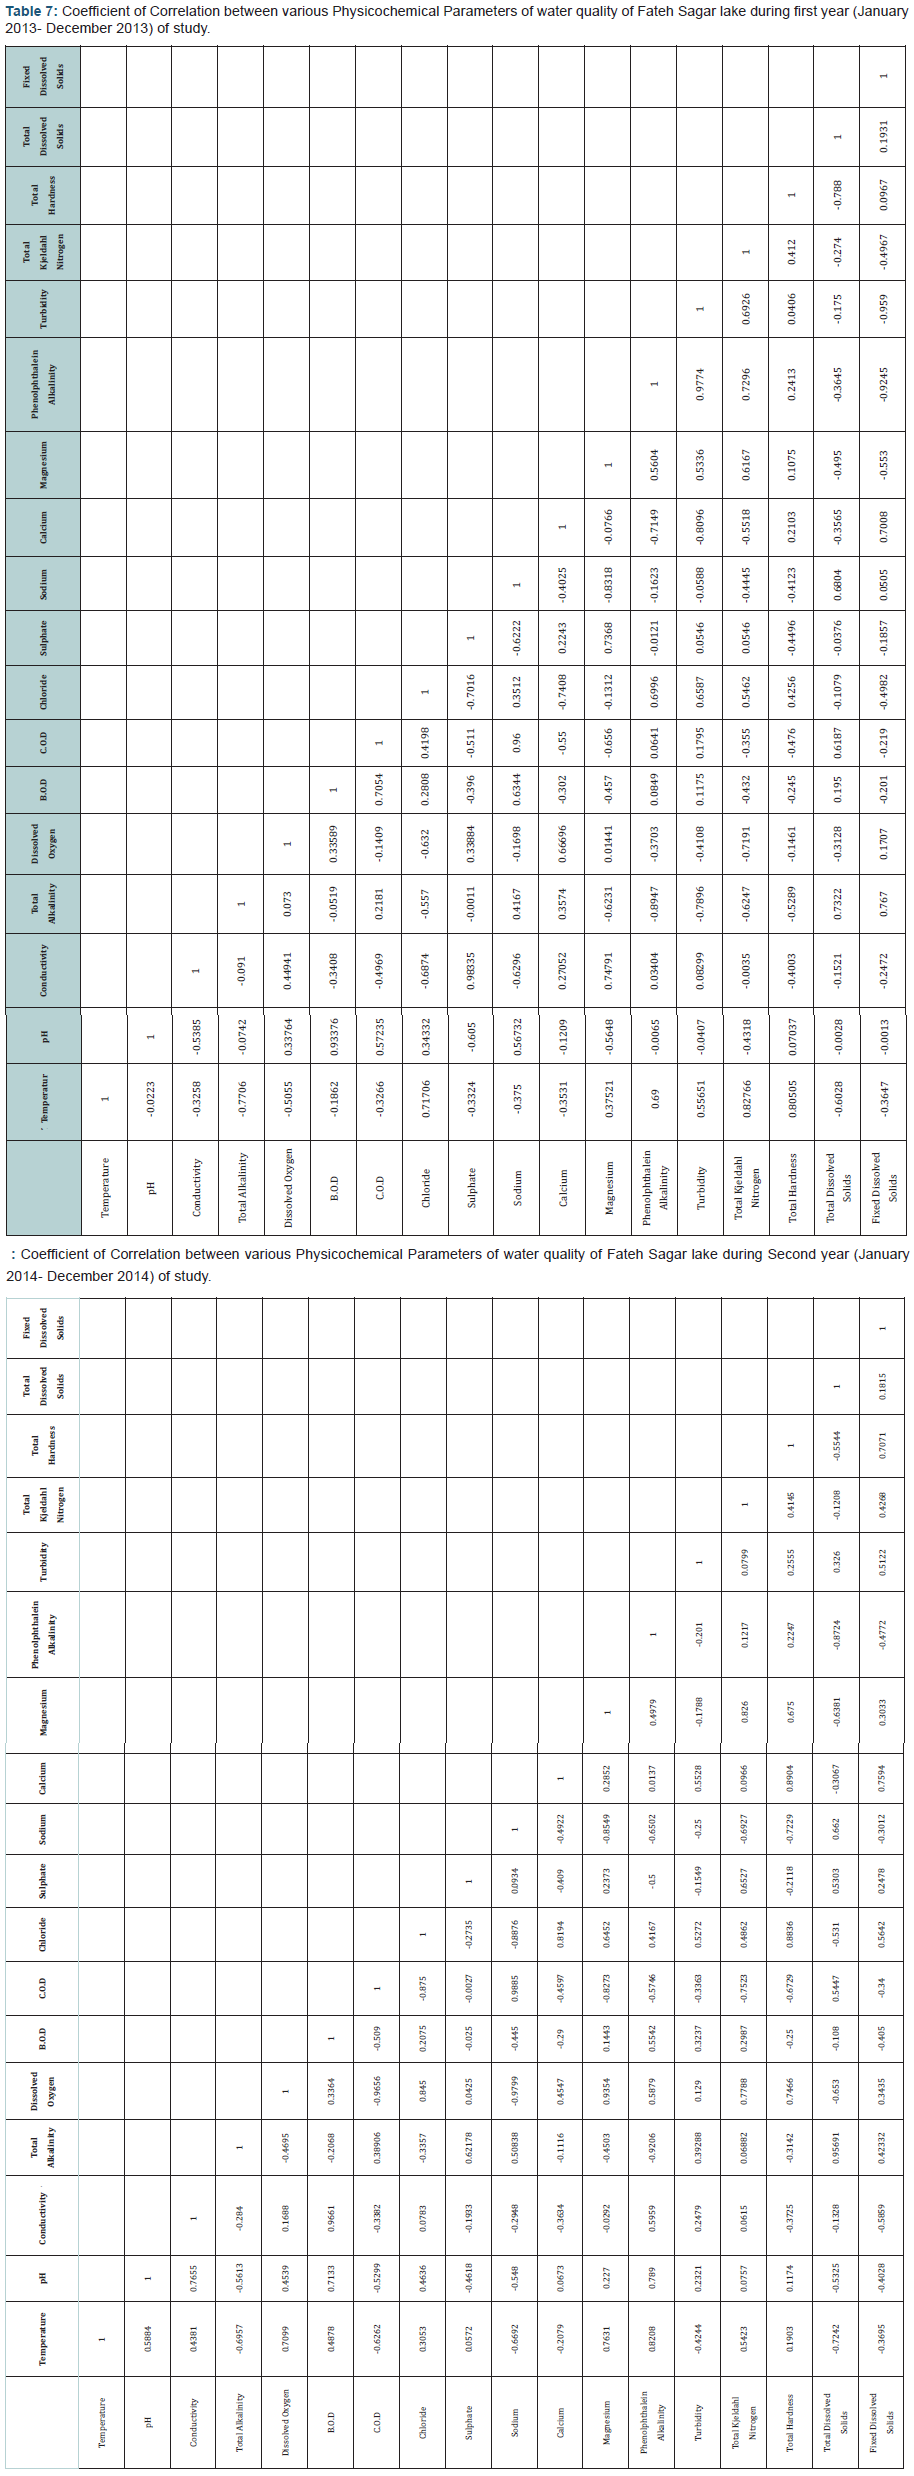
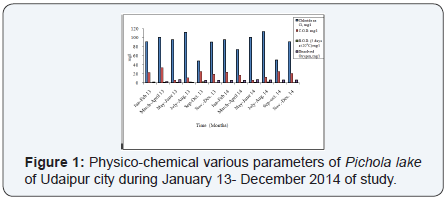
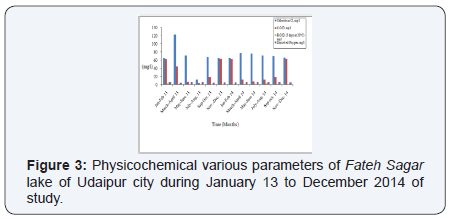
During two years of study of water sample of Fateh Sagar (Tables 3 & 4) very low temperature was recorded in Jan-Feb, 2014 (20-degree centigrade) whereas the high temperature was recorded during Mar-Apr, 2013 (24.6-degree centigrade).The pH content was higher during Jan-Feb, 2013 (8.7), lower in Jul-Aug, 2013(7.84). Conductivity was recorded highest during Jul-Aug, 2013 (1281) and lowest during Jul-Aug, 2014 (520). The amount of total Alkalinity was recorded higher during Sep-Oct, 2014 (150mg/l;) and lowest during Mar-Apr, 2013 (115mg/l) at lake sites. Higher values of Dissolved Oxygen were estimated during Jul-Aug, 2013 (6.74mg/l) and lower values estimated in Sep- Oct, 2013 (4.16mg/l) in Fateh Sagar’s water sample. The B.O.D. content was recorded higher during Jan-Feb, 2013 (3.40 mg/l) and lower during Jul-Aug, 2014(3.30 mg/l). The C.O.D. recorded highest during Nov.-Dec 2013 (63.1 mg/l) and the lower amount was recorded in the samples of industrial area’s water during May-Jun, 2013 (7.2 mg/l). The Chloride content was recorded highest during Mar-Apr, 2013 (122 mg/l) and lowest during Jul-Aug, 2013 (12.1mg/l). The lowest values of Sulphate were recorded during Jan-Feb, 2013, (29mg/l) and highest values in Jul-Aug, 2014 (68 mg/l). Sodium was found to be highest in the water samples of the lakes with its highest value recorded during Nov-Dec 2014 (81mg/l) and lowest value in Jul-Aug, 2013 (28 mg/l). The amount of Magnesium was recorded higher during Mar-Apr, 2013 (23.40 mg/l) and lowest in Jan-Feb, 2014 (2.80 mg/l). The Fecal Coliform content was recorded lowest during Jan-Feb, 2013 (3 MPN/100ml) and during Jul-Aug, 2014(7 MPN/100ml).Water samples Phenolphthalein Alkalinity lower values were estimated as zero and highest values in Mar-Apr, 2013 (27 mg/l). In Fateh Sagar’s water, Turbidity was highest during Mar-Apr, 2013(4NTU) and lower May June 13 0.27 NTU, respectively. In the samples of Total Kjeldahl Nitrogen were recorded maximum during Mar-Apr, 2013(1.93 mg/l) and minimum in Jan-Feb, 2013 (0.56 mg/l). In the case of Total Hardness, the lowest value was recorded in the months of Jul- Aug, 2013, at 99 mg/l and highest in the month of May-Jun, 2014 at 180 mg/l. Total Coliform lowest concentration was observed in the month of Mar-Apr, 2013 at 7 MPN/100ml and highest in the month of May-Jun, 2014 at 22 MPN/100ml. In comparison, the lowest concentration of Total Dissolved Solids was recorded in the month of May-Jun, 2013 at 226 mg/l and highest in the month of Nov-Dec, 2014 at 318 mg/l. In the case of Fixed Dissolved Solids lowest value was recorded in the month of Mar- Apr, 2013 at 84 mg/l and highest in the month of Mar-Apr, 2014 at 200 mg/l. While the highest value of Phosphate was recorded in the month of Jul-Aug, at 0.001 mg/l. Lowest concentration of Ammonical Nitrogen was observed at 0.07 mg/l in the month of Jan-Feb, 2013 and it was highest in the month of Mar-Apr, 2014 at 1.4 mg/l. During study period Boron Dissolved was highest in the month of Nov-Dec, 2014 at 0.23 mg/l. Higher values of Nitrate were estimated during Jan-Feb, 2014 (0.82mg/l) and the lowest Nov-Dec, 2014 (0.07mg/l). The lowest values of Potassium were recorded during Jan-Feb, 20130.4 mg/l and the highest value 2.7 mg/l in the month of Mar-Apr, 2014. The total Suspended solids content were recorded highest during Mar- Apr, 2014 (50 mg/l) and lowest Jul-Aug, 2014 (3.5 mg/l). The Lowest concentration of Fluoride was observed at 0.03 mg/l in the month of Jan-Feb, 2014 and it was highest in the month of Jul-Aug, 2014 at 0.70 mg/l. In present study the various kinds of pollutants in the water quality of the study sites and activity has been represented (Figures 1-4) of Pichola lake and Fateh Sagar.

Discussion
The use of water quality indices to verify the impact of Cordoba City (Argentina) on Suquia River [13]. water quality evaluation and trend analysis in selected watersheds of the Atlantic region of Canada [14]. An innovative index for evaluating water quality in streams [15]. Change (2005) reported spatial and temporal variations of water quality in the river and its tributaries in Seoul, South Korea, 1993–2002 [16]. The development of chemical index as a measure of instream water quality in response to land-use and land-cover changes [17]. That application of CCME Water Quality Index to monitor water quality: a case of the Mackenzie River Basin Canada [18]. Long-term water quality monitoring of the Sejnane reservoir in northeast Tunisia [19]. Assessed that application of two water quality indices as monitoring and management tools of rivers Case study: the Imera Meridiopnale river Italy [20]. Contributed application of physicochemical data for waterquality assessment of watercourses in the Gdansk municipality (South Baltic coast) [21]. Analysis of Ground Water Quality Parameters: A Review due to human and industrial activities, the ground water is contaminated [22]. This is the serious a problem at present. Thus the analysis of the water quality is very important to preserve and protect the natural eco system. The study of Physico-chemical and biological characteristics of this ground water sample suggests that the evaluation of water quality parameters as well as water quality management practices should be carried out periodically to protect the water resources.
Conclusion
The appraisal of lakes water in Udaipur’s lakes with respect to bacteriological and physicochemical pollution is of immense significance for improving the living standard and quality of life in this region. Therefore, monitoring of microbial contamination and pathogenic bacteria genera on a periodic basis is important and useful to arrive at measures that can act as indicators of water quality and pollution.
For more Open Access Journals in
Juniper Publishers
please click on: https://juniperpublishers.com/journals.php
For more articles in Open Access Journal of
Environmental Sciences & Natural Resources please click on: https://juniperpublishers.com/ijesnr/
To know more about Journal of
Environmental Sciences & Natural Resources
To read more…Fulltext
please click on: https://juniperpublishers.com/ijesnr/IJESNR.MS.ID.555560.php
To know more about Journal of Environmental Sciences & Natural Resources
To read more…Fulltext please click on: https://juniperpublishers.com/ijesnr/IJESNR.MS.ID.555560.php


Comments
Post a Comment