Mesopredator Release Theory: Comparing Mesocarnivore Abundance and Prey Choices in an Urban Landscape and Impacts on Prey Populations-Juniper Publishers
Juniper Publishers- Open Access Journal of
Environmental Sciences & Natural Resources
Mesopredator Release Theory: Comparing Mesocarnivore Abundance and Prey Choices in an Urban Landscape and Impacts on Prey Populations
Authored by Melissa L Karlin
Abstract
According to the mesocarnivore release theory, when apex carnivores from the landscape the populations of mid- to small-sized carnivores explode and many prey species decline. Apex predators are replaced by smaller mesocarnivores, such as domestic cats (Feliscatus), which should consume smaller prey such as birds, arthropods, and rodents, while larger mesocarnivores, such as Coyotes (Canislatrans), should prey on small mammals such as rodents and rabbits. The purpose of this research was to determine the abundance of mesocarnivores in two urban landscapes, and by determining their prey choices, estimate their impacts on small mammal and bird population abundance in their landscape.
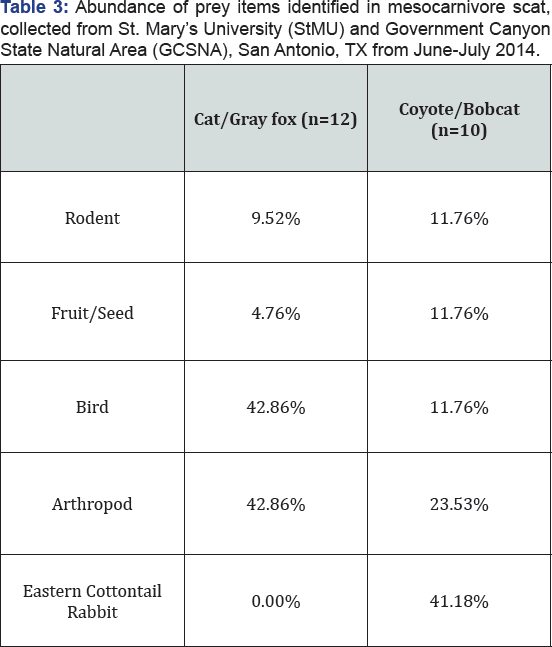
Birds and arthropods were found in highest abundance (42.86%) in cat and Gray fox (Urocyon cinereoargenteus) samples, while Eastern cottontail (Sylvilagus floridanus) was found in highest abundance (41.18%) in Coyote and Bobcat (Lynx rufus) samples. There was a significant difference in prey consumed between these two groups, as expected based on the mesopredator release theory. However, small mammal and bird abundance and diversity indices were similar when comparing the site with the Coyote as the apex predator with the site with cats as the apex predator, suggesting no significant impacts on these prey. Based on the results of primarily the scat analysis in this study, the mesopredator release theory was supported by these results and the difference between the groups was significant, although sample sizes were small.
Keywords: Coyote; Mesocarnivore; Mesopredator release; Small mammal
Abreviations: GCSNA: Government Canyon State Natural Area; StMU: St. Mary's University
Introduction
A 2013 study by the Smithsonian Conservation Biology Institute estimated that un-owned and owned free-ranging domestic cats (Feliscatus) kill between 1.4 and 3.7 billion birds and between 6.9 and 20.7 billion small mammals each year in the contiguous United States (U.S.) alone Loss et al. [1]. If these estimates are correct, this represents the largest source of human-related mortality of U.S. birds and mammals. The same study noted that it is the un-owned cats (farm and barn cats, strays, colony cats, and feral cats) that cause about 69% of the bird deaths and 89% of the mammal deaths. In situations where humans are providing an artificial food source to these cats, a process known as hyper predation may occur, in which a prey species can indirectly affect another prey species, by causing an increase in abundance of a shared predator Baker et al. [2]. In this scenario, the humans are acting as a prey species by providing a food source to cats, allowing the abundance of the cat population (the predator) to surpass the carrying capacity of the environment Baker et al. [2]. This causes an increase in predation of the other prey type (i.e., birds or small mammals) due to the inflated predator population size. Predation rates by individual cats may be lower when cats are provided an artificial food source, but the collective number of birds and small mammals killed in these scenarios are elevated because the number of predators present is above the carrying capacity of the area, up to densities 100 times or more high than native carnivore densities Coleman [3].
Large native carnivores such as Gray wolves (Canis lupus)or Mountain lions (Puma concolor) once served as apex predators in many ecosystems prior to urban settlement and habitat fragmentation Crooks & Soule [4]. These apex predators controlled population sizes of the mid-sized carnivores such as Coyotes (Canislatrans) through, in the case of wolves, territorial exclusion and aggressive interactions Smith et al. [5]. An indirect effect of this top-down control was that smaller prey items targeted by Coyotes or other mid- to small-sized carnivores were not heavily predated upon. When these apex carnivores disappeared across the U.S. due to predator control and urban settlement, the populations of mid- to small-sized carnivores exploded and many prey species declined, a phenomenon known as mesocarnivore release Crooks & Soule [4]. In many areas of the U.S., the Coyote has now risen to the role of apex predator, although it is a mid-sized carnivore, because the former apex predators have been extirpated Prugh et al. [6]. Cats can also function as mesocarnivores in continental ecosystems or even apex predators in island ecosystems Prugh et al. [6]. This apex role for cats is particularly true in heavily urban areas where Coyotes cannot exist, but free-ranging cats, un-owned by anyone in particular, are maintained by an urban human population.
In areas where Coyotes serve as the apex predator, they can suppress the population abundance of smaller carnivores such as Striped skunks (Mephitis mephitis), Raccoon (Procyon lotor), Gray fox (Urocyoncinereoargenteus) and cats Crooks & Soule [4]. One study documented an increase in scrub bird diversity in areas where Coyotes were present and these smaller carnivores were absent (due to being predated by the Coyote), and a corresponding decrease in bird diversity in areas where these smaller carnivores were present but Coyotes were absent Crooks & Soule [4]. Based on this example, ecosystems with coyotes present as the apex predator may have higher bird and small mammal's population diversity and possibly abundance, when compared to systems where the Coyote is absent and smaller carnivores abound. In light of the recent studies on the impact of free-ranging cats on prey such as birds and small mammals, ecosystems that have free-ranging cats as the apex predator may have extremely low levels of these prey when compared to ecosystems with Coyotes present.
Coyotes, Bobcats (Lynx rufus), and Gray fox are sympatric in many areas of the U.S. Whitaker & Hamilton [7], and can all be considered generalists in terms of habitat use; in terms of diet, Bobcats are mainly carnivorous while Coyotes and Gray fox are omnivorous Litvaitis & Harrison [8]. All three, however, prey on mammals Litvaitis & Harrison, Harrison [8,9]. A combination of competition for resources and intraguild predation among these three species may be present where they coexist Fedriani et al. [10]; a study in California documented Coyote dominance over Bobcats and Grayfoxes, with multiple Gray fox and Bobcat deaths attributed to Coyotes Fedriani et al. [10]. Diets of feral cats have been studied extensively on islands, where their impact on native fauna may be significant. They prey on arthropods, reptiles, birds, and lagomorphs Paltridge et al. [11-13]. On San Clemente Island, CA, Island fox (Urocyonlittoralis) and feral cats consumed similar proportions of birds, but feral cats consumed rodents and lizards at a higher frequency than Island foxes, which consumed more arthropods and plants Phillips et al. [13].
The purpose of this research was to determine the abundance of mesocarnivores in two urban landscapes, and by determining their prey choices and measuring prey abundance and indices, estimate their impacts on small mammal and bird populations in their lands cape in light of the mesopredator release theory. The objectives of this project were to quantify abundance of mesocarnivores, birds and small mammals at both sites and determine prey choice by mesocarnivores using scat analysis.
Study Sites
St. Mary's University
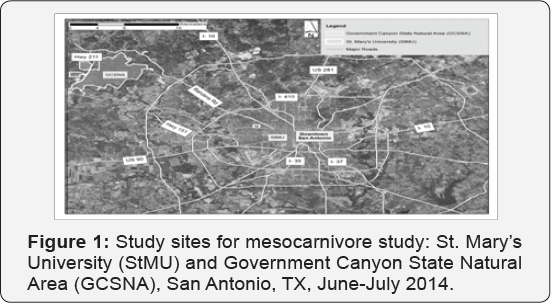
St. Mary's University (StMU) is located on the west side of San Antonio, Texas in a mixed residential/commercial urban and covers approximately 0.55 km2 (Figure 1). The campus is home to about 3,800 students and is in a heavily urban area. The majority of the land use on the campus is urban, impervious surfaces, with little green space. All areas of the campus are maintained by grounds keeping and no natural areas exist.
Government Canyon State Natural Area
Government Canyon State Natural area (GCSNA) is an approximately 47.04 km2 state natural area within the Balcones Canyonlands sub-region of the Edwards Plateau Ecoregion (Texas Parks & Wildlife 2005) and is located approximately 37 km north west of San Antonio, TX (Figure 1). Dominant vegetation includes Ashe juniper (Juniperus ashei) and a mixed deciduous component of Texas oak (Quercus buckleyi), Live oak (Quercus fusiformis), Cedar elm (Ulmuscrassifolia), Texas ash (Fraxinustexensis), and Escarpment black cherry (Prunus serotina) Watson The natural area has canyon lands and grasslands, is home to the endangered Golden-cheeked warbler (Dendroicachrysoparia) and has over 64 km of hiking trails, as well as a visitor center and campgrounds.
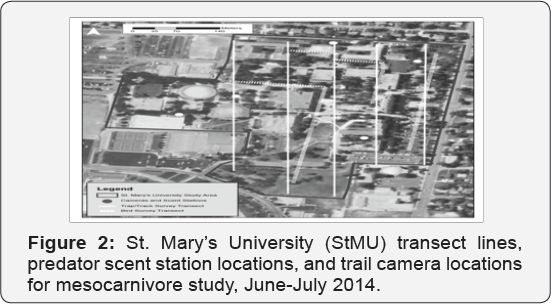
While GCSNA represents a large natural area, the location of this study within GCSNA was in the southernmost section of the natural area, and was the most heavily disturbed by neighboring urban development (Figure 2). The entry road to the park and offices passes through the study site, and the closest residential home was between 25 m and 1 km from the study area. This section of the natural area was selected for this study as it represented the region where impacts from edge effects and residential pets would likely be the greatest.
Materials and Methods
Small mammal surveys
All surveys, field work, and data collection were conducted from June - July 2014. At both sites, 20 Sherman Live Traps (7.62 cmby7.62 cm by 22.86 cm) and 10 track stations, spaced 10 m apart in an alternating pattern, were used to measure small mammal population diversity and abundance. At StMU, these 30 stations were laid in a straight line transect for four nights Kays , DeWan [14], and then moved 50 m to a new line, for a total of five transects and 600 total trap nights (number of traps multiplied by number of nights) O’Brien et al. [15] (Figure 2). At GCSNA, these 30 stations were laid in a straight line transect as well, and moved 50 m to a new line after four nights, for three transects and a total of 360 trap nights. The original location at GCSNA yielded no small mammal captures after 12 trap nights, and a severe Solenopsis invicta Buren (red imported fire ant) presence in the area. The trap line was moved to the grassy area in the southern section of the natural area, and the original trapping methodology was continued for an additional two transect lines and 240 trap nights (Figure 3). All traps were checked daily before 1000 h, and were reset each evening after 1800 h to avoid the day time heat. If an animal was captured, it was marked with a nonpermanent livestock marker paint pen, so that it would not be counted if captured again.

Small mammal track stations consisted of 60.96 cm plastic gutters inverted over an aluminum metal strip which had an approximately15.2 cmby12.7 cm area sprayed with a combination of 4 to 5 tablespoons of carpenters chalk and 473 ml of 98% isopropyl alcohol, followed by 15.2 cm by 12.7 cm sheet of contact paper, on each end, with a 2.54 cm wide bait station in the center Neal [16]. Traps were baited with peanut butter and track stations with peanut butter and bird seed. Contact paper strips recorded footprints from each track stations for later identification to the genus level. In addition, the small mammal abundance data collected at four camera stations (Figure 3) in GCSNA during a previous study (September-December 2013) were used to supplement small mammal abundance data on larger wildlife, such as Eastern cottontail (Sylvilagus floridanus). The cameras used during this previous study were the DLC Covert Extreme Black 60 (Covert Scouting Cameras, Lewisburg, KY). This camera was a black infrared camera with a 40 ft detection range; 12 megapixel (MP) picture resolution; a 1.2 second trigger speed; a variable trigger interval of 1 s - 60 min; takes pictures or video; includes 60 infrared black LED’s; and includes a date, time, temperature, and moon phase stamp on every picture. The infrared technology detects motion, and an animal must move into the detection zone in order to activate the camera Kelly & Holub. For the trail camera data, photos were analyzed to determine species type, and total number of individual species was calculated based on trap events Kelly & Holub, which consisted of a record of an animal within a 30 min period. If the same species was recorded within 30 min, it was assumed to be the same individual and was not counted. This research was authorized by the St. Mary’s University Institutional Animal Care and Use Committee, Approval No. STMU-2014-7.
Bird surveys
Bird abundance and diversity was measured for both sites during three bird surveys, covering three transects at each site. The surveys followed guidelines established by the Expedition Field Techniques from Bird Life International Bibby et al. [17]. Birds were surveyed from transects at each site, as illustrated in (Figures 2 & 3). The observer stopped for 3 min at every 100 m distance mark along the transects, and recorded the abundance and species of birds visible from the transect line. Transect locations were selected based on building configuration at StMU and to cover both areas surveyed for small mammals at GCSNA. Total transect length at StMU was 1.5 km and 2.75 km at GCSNA. All surveys were conducted between 0700-0900 h, when wind speeds were less than 12 mph, and when there was no precipitation [18].
Mesocarnivore surveys
Five predator scent stations were established at each study site (Figures 2 &3), which consisted of a fatty-acid impregnated predator scent disk (USDA APHIS) placed in a mesh stocking and hung from a branch, placed over a track pad Kays & DeWan [14]. For this study, 50 cm by 75 cm sheets of aluminum flashing painted with a combination of 4 by 5 tablespoons of carpenters chalk and 473 ml of 98% isopropyl alcohol were used as the track substrate, and contact paper placed in the center of the flashing was used as the track pad (Neal 2007). Animals were identified based on the track records using an animal tracks identification guide Murie et al. [19]. A DLC Covert Extreme Black 60 (Covert Scouting Cameras, Lewisburg, KY) trail camera was also placed at each scent station to record predators). (Figures 2 &3) Predator abundance data collected at four camera stations (Figure 3) in GCSNA during a previous study (September- December 2013) was also included to supplement the survey of predator abundance.
Scat Analysis
Scat was opportunistically at both study sites to determine the diets of carnivores in the study areas. Scat samples were collected along trapping transects lines and was identified to the species level when collected. Samples were stored in a freezer until they could be analyzed. For analysis, the samples were thawed, dried in an oven at 200°F for 24 hr, and placed in a mesh stocking and rinsed in running water to separate the items, similar to methods followed by Phillips et al. [13]. Scat contents were categorized into prey groups (rodent, rabbit, bird, arthropod, and fruit/seed), non-preyitems (e.g., twigs, rocks, vegetation), and an unknown category, similar to Phillips et al. [13]. Prey items were identified to the most detailed taxonomic level possible.
Data analysis
Species richness (S), Shannon diversity index (H), and the Shannon's Equitability index (EH) (Molles [19]) were calculated for birds, small mammals and mesocarnivores, using survey data, trap event data from trail cameras and trapping data from small mammal traps and track pads. S was a measure of the number of different species present; H was a measure of species abundance and diversity; and EH was a measure of evenness among the species present. Based on the scat analysis, the Pianka Index was calculated to determine dietary overlap between the mesocarnivore species Pianka [20,21]. The Pianka Index ranges from 0 (no dietary overlap) to 1 (complete dietary overlap).A Chi-Square analysis (α = 0.05) was conducted to determine if abundance of prey types consumed by mesocarnivores differed between species.
Results
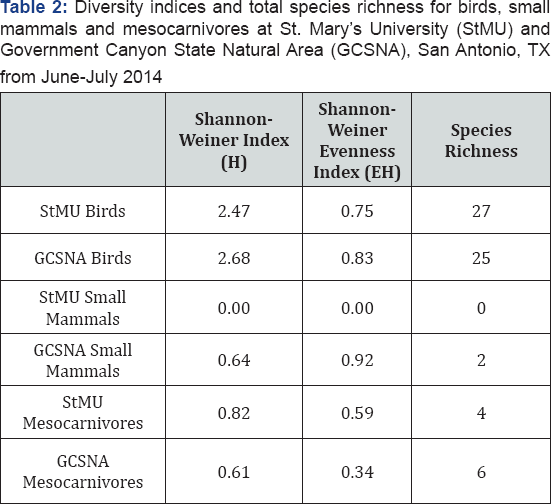
No small mammals were captured in the traps or recorded on the track pads at StMU. At GCSNA, only two small mammals were captured in the traps, both White-footed mice (Peromyscusleucopus). No small mammals were documented on trail cameras at StMU, but Eastern cottontail was documented by a trail camera in the GCSNA study area. At StMU, mesocarnivores documented by trail cameras included striped skunk, cat, domestic dog (Canis lupus familiaris), and Virginia opossum(Didelphis virginiana); at GCSNA, coyote, bobcats, gray fox, Feral pig (Susscrofa), striped skunk, and raccoons were documentedon trail cameras in the September - December 2013 data collection period and the current June - July 2014 period (Table 1). No domesticcats were recorded at GCSNA. The track pads for mesocarnivores were discontinued after two trapping sessions because the trail cameras documented all required data.
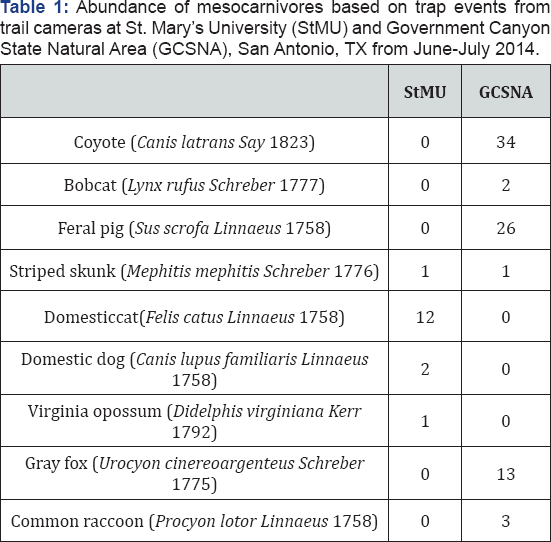
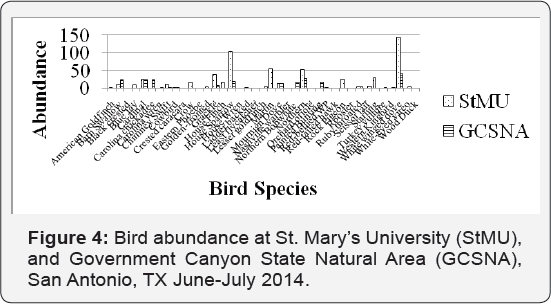
Cats dominated the mesocarnivores at StMU (75% of trap events) and coyotes dominated the mesocarnivore population at GCSNA (43%). Total species richness (S) for small mammals was low at both sites, although the small mammals documented at GCSNA were similarly represented, as indicated by the EH value (Table 2). H values for small mammals and mesocarnivores were similarly low for both sites, considering the potential range of 1- ln S. Bird species richness and H, however, were high at both sites and showed a similar distribution between the sites (Table 2). The abundance of each particular bird species, and the rarity of the species, however, varied considerably between the study areas (Figure 4).
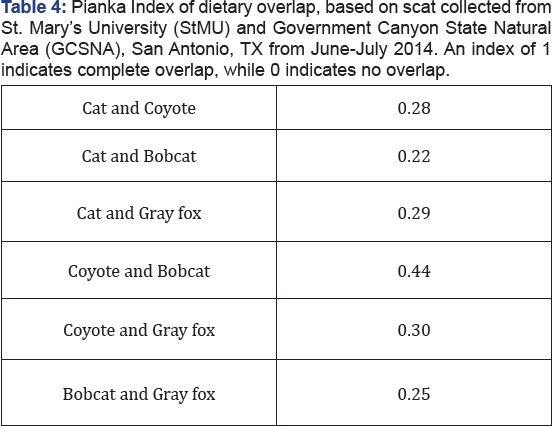
Although small mammals were not captured at StMU and were captured in limited abundance at GCSNA, the scat analysis revealed the most common prey items of these groups. Because of their similar prey choices based on trophic level, cat and gray fox scat samples were combined for analysis. A total of 11 cat, one gray fox, four bobcat, and six coyote scat samples were collected. Birds and arthropods were found in 75% of cat/Gray fox samples, and Eastern cottontail rabbit was found in 70% of the Coyote/Bob cat samples. By total prey items, birds and arthropods were the most abundant items (42.86% each) in cat/Gray fox scat, and Eastern cottontail rabbit was the most abundant (41.18%) in Coyote/Bobcat scat (Table 3). There was a significant difference in the number and type of prey consumed between the two groups (χ2 = 13.44, df = 4, p < 0.05), although n values were low. Vegetation (mostly grass) was found in 90% of the cat/Gray fox scat and in 36% of the Coyote/Bobcat samples. The Pianka Index of dietary overlap, however, was low for all mesocarnivore comparisons (Table 4).
Discussion
There were no correlations between predator abundance and small mammal abundance at either site, due to the lack of data from the small mammal trapping. This may have been due to the time of year: the summer heat and the abundance of other food sources; or the prevalence of Fire ants at both study sites which were attracted to the bait. However, a small mammal trapping study conducted at GCSNA from 1999-2008 revealed a steady decline in small mammal numbers, from a high of 45 individuals during a two night trapping period, to 0 individuals (D. Ribble, Trinity University, San Antonio, TX, 2014 unpubl. data). This suggests that actual small mammal abundance at GCSNA may be very low. At StMU, rodent traps are also placed near many of the buildings to keep the population low, which may explain the lack of small mammals recorded at StMU. Bird surveys revealed similar numbers and diversity of species at both sites, although GCSNA had species such as the Painted Bunting (Passerina ciris) and Northern Bobwhite (Colinus virginianus) that preferred more natural, grassy habitats, while StMU had an abundance of typical urban species such as House Sparrows (Passer domesticus), White-winged Doves (Zenaida asiatica), and Northern Mockingbirds (Mimuspolyglottos).
Mesocarnivore numbers based on trap events at GCSNA may be inflated since they are based only on a 30 min threshold, whereas at StMU, the cats had identifying features (e.g., color patterns) so in addition to the 30 min threshold, the trap events could be filtered by these features. Based on this abundance data, cats were the dominate mesocarnivore at StMU and Coyotes were the dominate mesocarnivore at GCSNA. The low Shannon indices for both sites reflected that there were a few, very abundant, species at both sites, such as the cat and Coyote, and overall diversity and species richness were low. Given the heavily urban setting of StMU, a wide array of mesocarnivores was not expected and these low indices reflect the nature of the urban environment; the low indices at GCSNA support the premise that this region of the natural area may be disturbed by the neighboring urban areas. Based on the high abundance of Coyotes (Table 1), this mesocarnivore may also be dominating the landscape at GCSNA and restricting the presence of other species. This may explain why no cats or domestic dogs, and very few small mesocarnivore species such as Striped skunks, were documented at GCSNA. The scat analysis became the focus of this study after a disappointing small mammal trapping season, and while sample sizes for this analysis were low, the clear separation between bird abundance in the cat/Gray fox samples and Eastern cottontail abundance in Coyote/Bobcat samples was in line with other published reports of prey choices for all the mesocarnivores. It does not appear, however, based on the indices calculated, that the site with cats as the apex predator has less of an abundance of small mammal or bird species than the site with Coyotes as the apex predator. This is contrary to many other studies which document higher bird and small mammal population diversity and abundance in systems where the Coyote is present Crooks & Soule, Prugh et al. [3,6].
Plant material was found in a high number of cat/Gray fox samples, which has been reported in low numbers from other cat studies Phillips et al. [13]. The Pianka index of dietary overlap revealed expected low numbers when comparing cat to both Coyotes (0.28) and Bobcats (0.22), but also a low overlap when compared to the Gray fox (0.29). This, however, is due to the fact that only one Gray fox scat sample was obtained. The highest dietary overlap, as expected, was between Coyotes and Bobcats (0.44), which was also lower than may have been expected and may also be attributed to low sample sizes.
According to the mesocarnivore release theory, the smaller mesocarnivores such as cats and Gray fox should consume smaller prey such as birds, arthropods, and rodents, while the larger mesocarnivores, such as the Coyotes and Bobcats, should prey on small mammals such as rodents and rabbits. Based on the results of primarily the scat analysis in this study, this theory was supported by these results and the difference between the groups was significant, although sample sizes were small. However, there did not appear to be a significant difference in bird and small mammal abundance between the sites, even though cats appeared to prey preferentially on birds in this study. Additional scat samples from both sites and a longer study duration, however, may yield more insight on the impacts of cats in the StMU urban landscape.
For more articles in Open Access Journal of Environmental Sciences & Natural Resources please click on: https://juniperpublishers.com/ijesnr/
To know more about Open Access Journals Publishers
To read more…Fulltext please click on: https://juniperpublishers.com/ijesnr/IJESNR.MS.ID.555600.php



Comments
Post a Comment