Minimizing Vehicular Traffic via Integrated Land use Development: a Heuristic Optimization Approach-Juniper Publishers
Juniper Publishers- Open Access Journal of Environmental Sciences & Natural Resources
Electro-Fenton Oxidation of Simulated Pharmaceutical Waste: Optimization using Central Composite Design
Authored by Hajira Tahir
Abstract
In this paper, Diclofenac sodium drug removal was studied by electro-Fenton process, and utilizing an iron electrode to engender Fe2 + ions in a batch reactor. In order to reach the maximum efficiency of the process, efficacious parameters such as: NaCl, H2O2, electrode distance and electrolysis time were investigated. The experimental data designated that all operational parameters played a paramount role in the process. High R2 (82.24%) drug removal, (84.69%) COD abstraction by Fenton like advanced oxidation process, is exhibiting the efficacy of the model. The 80% drug and 91% COD removals were observed at optimum levels of factors. The kinetic study of the drug removal was also performed.
Keywords: Central composite design; Diclofenac sodium; Electro-Fenton process; Kinetic study; Cost and Energy consumption
Highlights
a. The removal of simulated pharmaceutical waste by Electro-Fenton (EF) process.
b. The study based on Central composite design.
c. Kinetic study of drug removal.
d. Cost analysis.
Abreviations: PCPs: Personal care products ; EDCs: Endocrine disrupting compounds ; DCF : Diclofenac ; WWTPs: wastewater treatment plants
Introduction
Emerging contaminants such as pharmaceuticals, personal care products (PCPs), pesticides, synthetically and naturally occurring hormones, flame retardants and some disinfection by-products, most of them considered as potential endocrine disrupting compounds (EDCs), usually end up into the wastewater cycle after their industrial and domestic uses. Since the conventional treatment technologies are not effective for the removal of these contaminants [1]. This is due to many of these compounds can be adsorbed in the tissues of animals and humans (especially liver and kidneys). Bolong et al. [2] reported that many EDCs can produce adverse effects in aquatic biota, indicating that the exposure is mainly by ingestion of these substances, inducing to bioaccumulation.
High concentrations of emerging contaminants have been found in birds and marine mammals. Therefore, due to the biotransformation capability of these compounds, the degradation products (modified metabolites) usually can be more harmful than the original substances [2]. Pharmaceuticals have a very significant consideration between the found substances in wastewater, and sewage treatment plants effluents. The annual production of pharmaceutical compounds has been estimated in thousands of tons worldwide. Diclofenac (DCF) (2-[(2, 6-dichlorophenylaminobenzeneaceticacid) is a common non-steroidal anti-inflammatory drug, which has been found in domestic wastewater and various water bodies. More than 1000 ton of DCF are manufactured and consumed in China every year.
Conventional wastewater treatment technologies such as the activated sludge process have little effect on the removal of DCF [3,4]. Previous research on DCF removal has been focused on two types of methods to decrease the toxicity of DCF [5], one is advanced oxidation, and the other is advanced reduction. -OH or other oxidants attack DCF molecules directly in the advanced oxidation methods, while hydrated electrons exchange with the chlorine atoms of DCF molecules in the advanced reduction methods. Examples of the advanced oxidation methods include Fenton or Fenton-like oxidation [6,7], ultraviolet irradiation [8,9], ozone oxidation [10,11], radiolysis [12], ultrasonic treatment, and ultrasonic irradiation assisted advanced oxidation [13-15].
Diclofenac (DCF) is an acidic pharmaceutical which belong to the non-steroidal anti-inflammatory drugs (NSAIDs) family. This drug is widely used in the relief of pain and inflammation, the prevention of intra-operative meiosis during cataract extraction, the treatment of inflammation after surgery and laser eye treatment, and the relief of ocular signs and allergic conjunctivitis. Therefore, DCF is one of the top 10 compounds most commonly found in aquatic environments, due to its high level of consumption and that its removal percentage in conventional wastewater treatment plants (WWTPs) can be even less than 20%. It has been detected in rivers, WWTP effluents, estuaries, surface water, ground water and even drinking water in many countries at 1g-ng L-1 concentration levels [16].
A recent survey en European river waters revealed that carbamazepine, diclofenac, caffeine and ibuprofen were detected in 95%, 83%, 62% and 35% of collected samples respectively [17]. It has been found in livers, kidneys and gills of fishes and correlated to physiological alterations in animals even at concentrations of 1g L-1. It is one of the few drugs, together with the hormone17a-ethinylestradiol, that can be considered to present toxic effects on bacteria, invertebrates and algae [18,19]. Among the various organic pollutants that are considered to cause environmental hazard; phenolic compounds occupy a prominent position. Many of the widely used drugs, pesticides contain a phenolic part. As a model compound we have chosen Aspirin and Diclofenac sodium.
These heat and light resistant, biological non-degradable [20]. Stable drugs effluents are treated by several physical, chemical, and biophysical processes. Among which adsorption, precipitation, coagulation-occultation, oxidation-coronation, biological and advanced oxidation processes are widely used for the degradation of waste water containing drugs materials. Precipitation method is not very advantageous because it results the sludge formation while in adsorption adsorbent needs to be regularly regenerated. Biological methods are not effective for the complicated aromatic compounds [21] Among Advanced Oxidation Processes (AOPs) technologies like ozonation [22], UV/H2O2 , [23] or Photocatalytic oxidation [24] , the electro- Fenton process has a high potential to ensure the mineralization (conversion into CO2 and H2O) of organic pollutants and micro pollutants. In the process, powerful oxidant hydroxyl radicals (•OH) are produced in an electrochemically assisted Fenton's reaction involving hydrogen peroxide (H2O2) and ferrous ion, according to the following reaction: [25].
Fe+2 + H2O2 →Fe+3 + •OH + OH- (1)
Since this reaction takes place in acidic medium, it can alternatively be written as:
Fe+2 + H2O2 + H+ → •OH + OH-+ H2O (2)
H2O2 is formed via the two-electron oxygen reduction reaction (ORR) at the cathode:
O2 + 2H+ + 2e- → H2O2 (3)
Ferrous ions are consumed more rapidly than they are produced. In addition, ferrous ions can be rapidly destroyed by hydroxyl radicals with the rate constant in the range of 3.2- 4.3×10⁸M-1.s-1 [26].
Fe+2 + •OH →Fe+3 + OH- (4)
The hydroxyl radicals, which have high oxidizing potential degrade organic compounds (RH) into radicals (R•).After radical formation step and then are finally mineralized into harmless gases and ions etc [27].
Organic radical(R•) radicals can also be formed due to gain of hydrogen atom from aromatic ring by 'OH [28]. The degradation pathway of organic molecule by the hydroxyl (•OH) radicals as follows [29]:
OH• +RH →H2O + R• (5)
R• + H2O2 →ROH + OH• (6)
R• + O →ROO• (7)
ROO• + RH →ROOH + R• (8)
RSM is a statistical implement avail to study the individual and interactive effects of variables on replication. Central Composite Design was employed to evaluate the effect of consequential operational parameters NaCl, H2O2, electrode distance and electrolysis time on drug, COD abstraction efficiencies. In this design five levels of factors was studied to check the paramount of operational parameters on response like % drug and COD removals. So study at five levels provides a detail data about the factors influence on replications. The simulated drug system was studied [30].
The main purposes of this research were as follow:
I To investigate the removal of DCF in aqueous solution by electro fenton reaction,
II. The optimum operational parameters for the removal of drug was found by central composite design
Experimental Details
Reagents
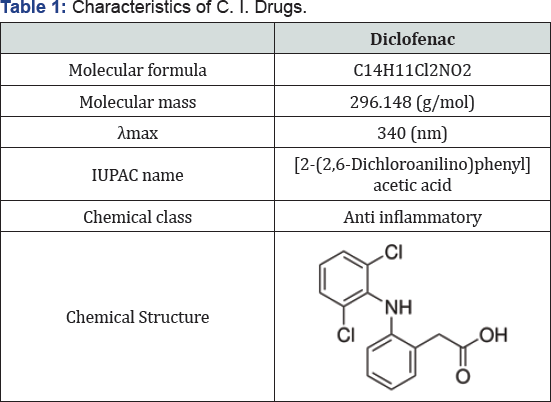
The active of Diclofenac sodium was purchased from Sandy Zhang Daily Hi Industry (Shanghai) Co., Ltd. Analytical grade Hydrogen peroxide (30%, d = 1.11 g/mL), sulfuric acid and sodium hydroxide were of laboratory reagent grade (Merck Co.) , and used without further purification. The structure of drug and characteristics are given in (Table 1).
General procedure
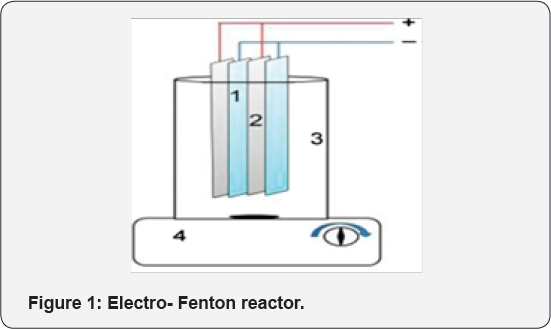
Wastewater was prepared synthetically by dissolving drug in distilled water. The structure of drug is shown in (Table 1). All the other chemicals were used of analytical grade. For UV- visible absorbance measurements, a T80 UV/VIS Spectrometer was used. As a power supply, a digital DC power supply (Yaxun 1502DD; 15V, 2A) was used to perform Electro-Fenton (EF) experiments. A 78HW-1 serial constant-temperature magnetic pug mill stirrer is used to perform agitation of the solution during EF experiments. As EF reactor, 500 mL beaker was used. Iron anode and iron cathode were used to perform EF tests.
COD Determination
Samples were centrifuged and filtered to remove MnO2. MnO2 is used to decompose residual H2O2 .COD was measured by the closed reflux colorimetric method in accordance with Standard Methods (1995). The detection of color value was done according to Method 2120C in Standard Methods (1995) [18].
Experimental Design
Experimental Design, Data analysis and Process Optimization
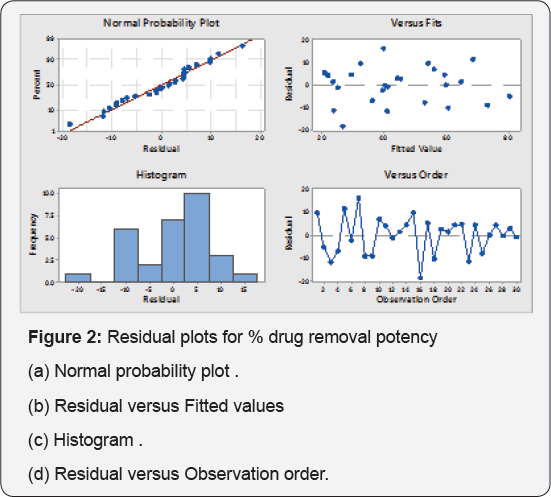
RSM is a statistical approach for the optimization of operational parameter both at laboratory and industrial scale [24] . This is very helpful tool to study the effect and optimization of number of factors at a time on single response surface sheet [25] . RSM employs a low-order polynomial equation for choosing significance and optimization of parameters [31]. RSM provides the smallest number of experiments than conventional approach [32]. In the present study, Central Composite Design (CCD), this is a wide used sort of RSM. It has been worked for the improvement of photo like treatment of textile effluent. It is a perfect design tool for successive experimentation, and permits testing the lack of fit when an adequate range of experimental values are accessible [26]. A total of 31 experiments were employed in this work, including 24 = 16 cube points, 7 replications at the center point, and 8 axial points. Experimental data were analyzed using Minitab 17 software.
Results and Discussion
The response surface is customarily portrayed graphically, where the contour plots are typically drawn to visualize the shape of the response surface [8]. The first step in RSM is to provide an opportune data of replication due to operational parameters either by the first order model or the second order model [10].

Where Y is the predicted response used as a dependent variable. The XiXj show the independent variables. While β0 is the constant coefficient, and βi ,β ij and β ii are the coefficients of linear, interaction and quadratic term, respectively.
The following second-order polynomial equation is obtained for % color and COD removal potency as follows:
%ColorRemoval=-832+ 118.1 A+ 67.4B + 27.0C + 11.51 D -11.28A ×A- 5.26 B×B-.031 C×C-0.0261D ×D+ 5.00A ×B- 1.74 A×C- 0.789 A×D+ 0.69 B×C -0.353B ×E- 0.278C ×D (10)
%CODremoval=-1230+175.6 A+ 165.7 B+ 36.1C + 6.82 D-16.56 A×A -9.80 B×B-0.975 C×C-0.0767 DxD- 1.87 A×B- 2.81 A×C + 0.356 A×D-1.33 B×C+ 0.000 B×D-0.074 C×D (11)
Determination Coefficients and Residuals Analysis
The regression coefficient R2 helps to find the relation between observed and predicted response of the process. The R2 of 0.7854 is showing a close relation with predicted response. It is indicated that the 78.54% variations in response is due to the effect of operational parameters. Adjusted R2 is withal a quantification of goodness of a fit, but it's more felicitous for comparing models with different numbers of independent variables. It rectifies R2-value for the sample size and the number of terms in the model by utilizing the degrees of freedom on its computations. If there are many terms in a model, and not profoundly and immensely colossal sample size, adjusted R2 may be visibly more diminutive than R2 [33-34]. Here, adjusted R2 value (0.5975) is very proximate to the observed R2 value.[Table 2,3]
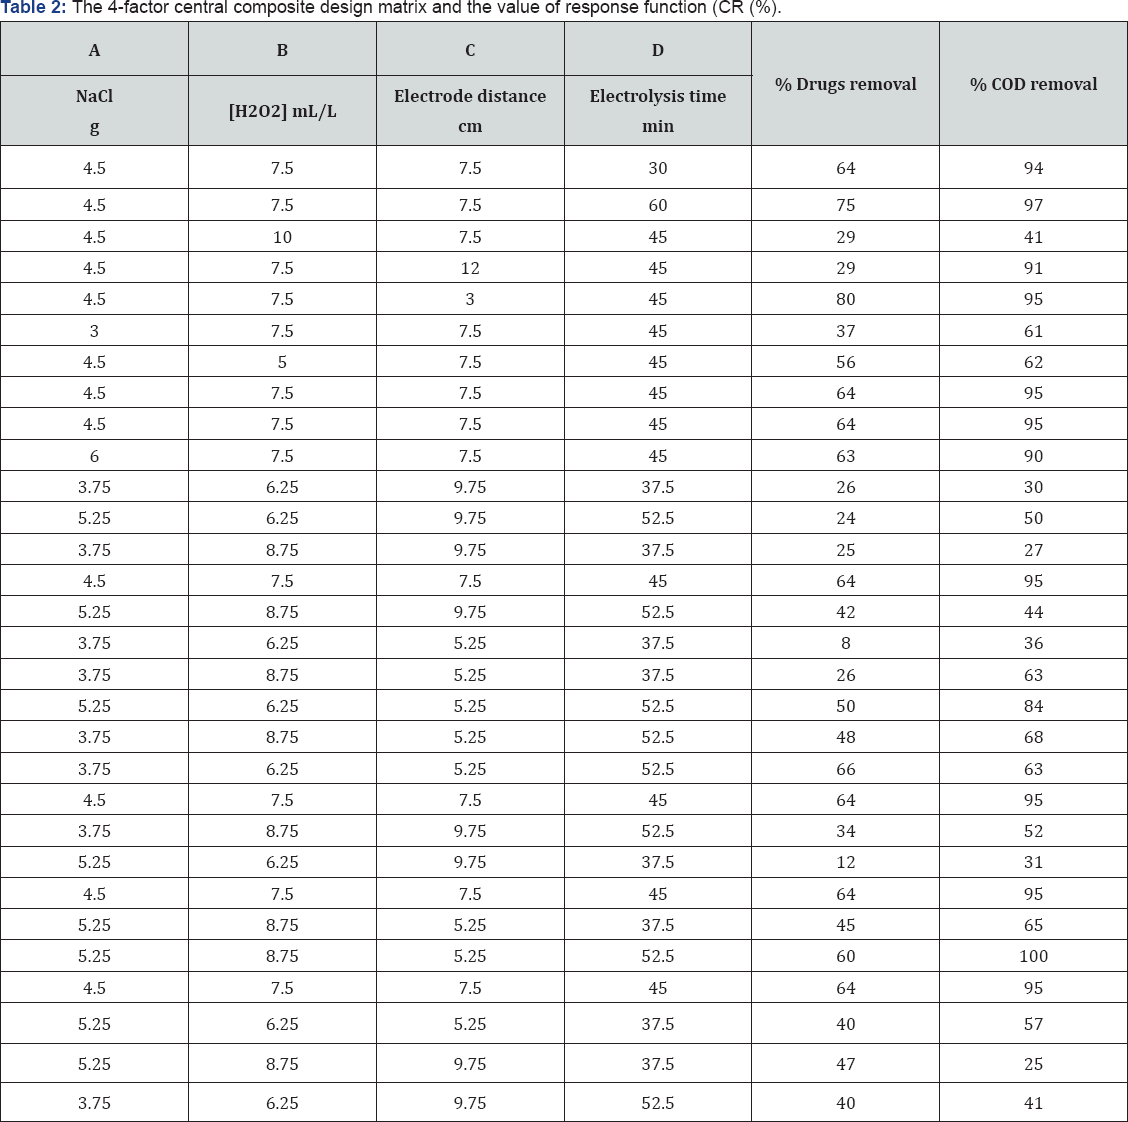

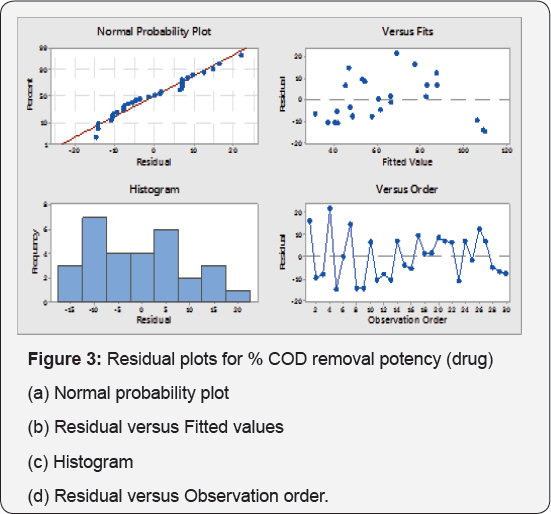
Residual plots help to check the adequacy of the models. Residuals are the differences between observed and predicted responses. Normal probability plots show the normality of the residuals. The observed residuals are premeditated against the expected values, given by a normal distribution (Figures 2a & 3a). The residuals from the analysis should be normally distributed. If number of observation are large than minimum deviation in normality plot it does not matter. The normal probability plot of the residuals should follow a line. Trend observed in Figures 2a & 3a, reveal data is overlapping the true line. Figures Figures 2b & 3bshow the residuals versus the fitted values. Data is scattering around zero line. Figures 3c & 4c illustrate the residuals in the order of the next observations, and also the histogram of the residuals distribution. It shows that the residuals in the plot fluctuate during a random pattern round the line of error zero.
Analysis of Variance


It is an integral part of data analysis to check the model adequacy [35]. Tables 4-6 given below shows the Analysis of Variance (ANOVA) results of the established model for % drugs and COD removals. The mean squares were obtained by dividing the sum of squares of each of the two sources of variation, the model and the error (residual) variance, by the respective degrees of freedom (DF). The model F-value was calculated by dividing the model mean sq. by residual mean square. Values of Prob > F less than 0.0500 imply that the model is significant, whereas the values greater than 0.1000 are sometimes thought- about as insignificant. Prob > 0.004 value is denoting that the polynomial model is fit for drugs removal, respectively.
On the other hand, the high Prob > F value (0.813) obtained for % COD removal reveal that the model is insignificant ; this is because of fact that color removal is just due to degradation of ago linkage and chromophore groups while for COD removal complete mineralization of dye is required. So same % drug and COD removal data was not obtained. The highest R2 obtained for drugs removal efficiency denotes that 78.54% of the total variation may be depicted by the established model expressing a satisfactory quadratic fit. However, in terms of COD removal, only around 35.16% of the total variation can be explained by the model (R2 = 0.6063). Considering the above explained multivariate analysis check results, the model application explained the reaction quite well, and can be used to navigate the design space at least in terms of drug and COD removal efficiencies.
Pareto Chart Analysis
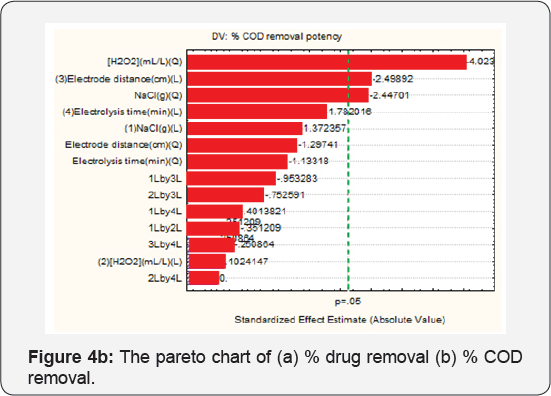
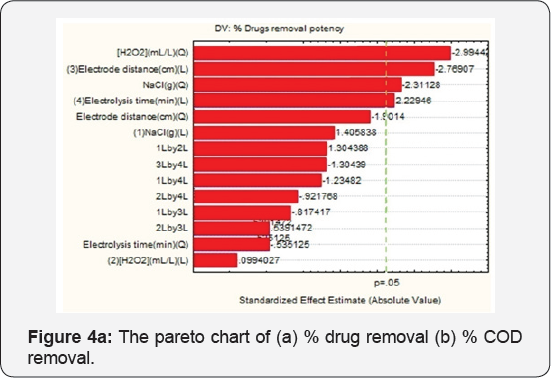
The Pareto Chart of standardized effects at P=0.05 is shown in Figure 4 The standardized effects are used to evaluate the effect of each factor and their interactions, and any value higher than absolute value is considered significant. Figure 4a shows that [H2O2] (quadratic) and electrode distance linearily, NaCl (quadratic), electrolysis time (linear) are significant. Figure 4b is the Pareto chart for % COD removal potency. [H2O2] (Quadratic), electrode distance linearily and NaCl (quadratic), are the most significant factor for % COD removal potency, which is agreed from Pareto chart.
Main Interaction Plots
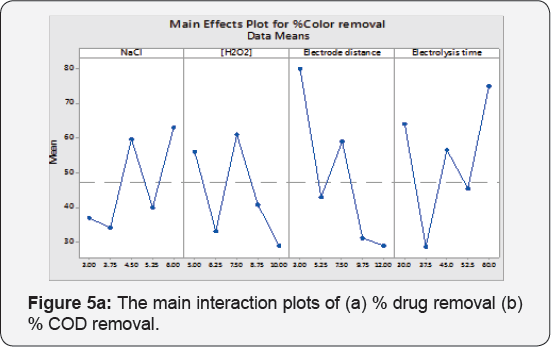
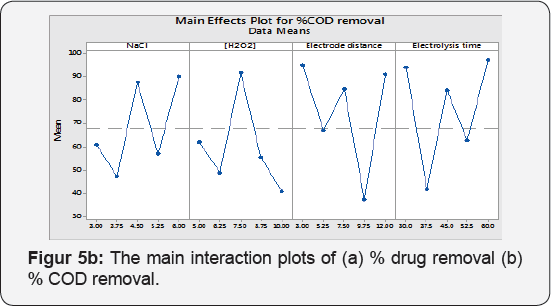
The simplest graphical tools (Main Effects Plot) are to see, whether, the analysis pattern is statistically vital or not. In this plot, the response mean is plotted against levels of operational parameters. There is no main effect: When factors level response overlap x -axis (response mean). In the following plot Figure 5a & 5b is showing that factors levels significantly moving the target mean value.
Full Interaction Plots
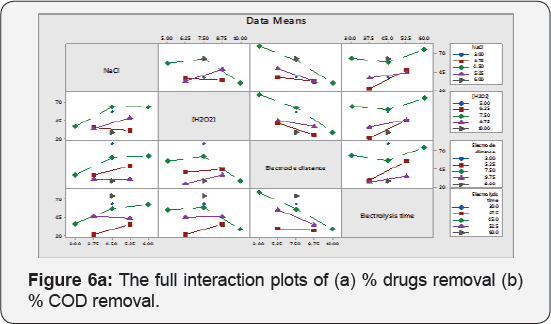
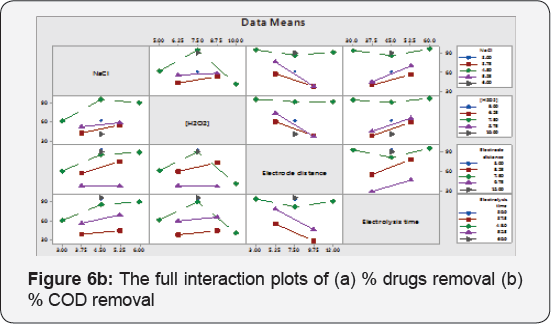
These are the plot between variables at a time and corresponding response is premeditated .This plot shows response means for the levels of one factor on the x-axis and a separate line for each level of another factor. If Parallel lines are observed means, there is no variation in target response due to amendment in factors levels. If response slope is higher, means additional robust interaction is present among levels of factors for the target response. These plots are reciprocal to anova test. Interaction plots are very useful if significant interaction is present among factors for the response value. The lines are not parallel in Figure 6a & 6b for % drugs removal and % COD removal potency.
Variables Effect on Drugs Removal
Representation of Variables Effect as Response Surface and Counter Plots
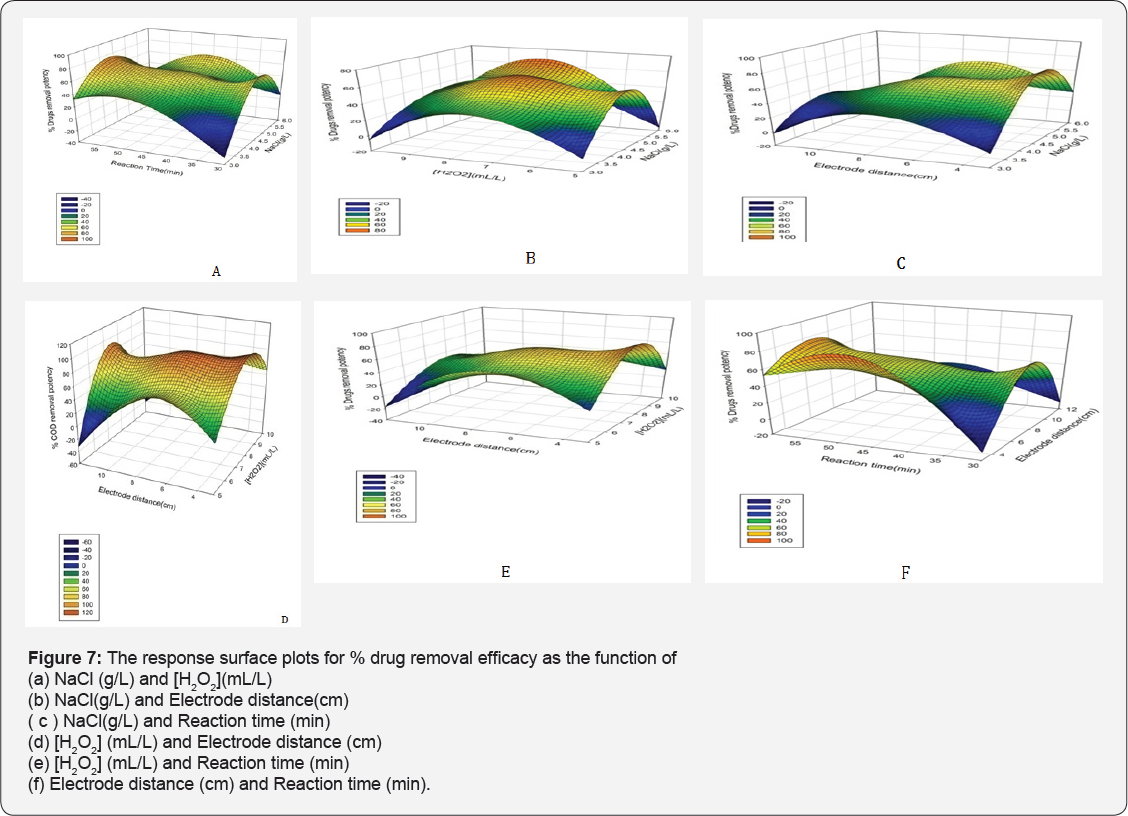
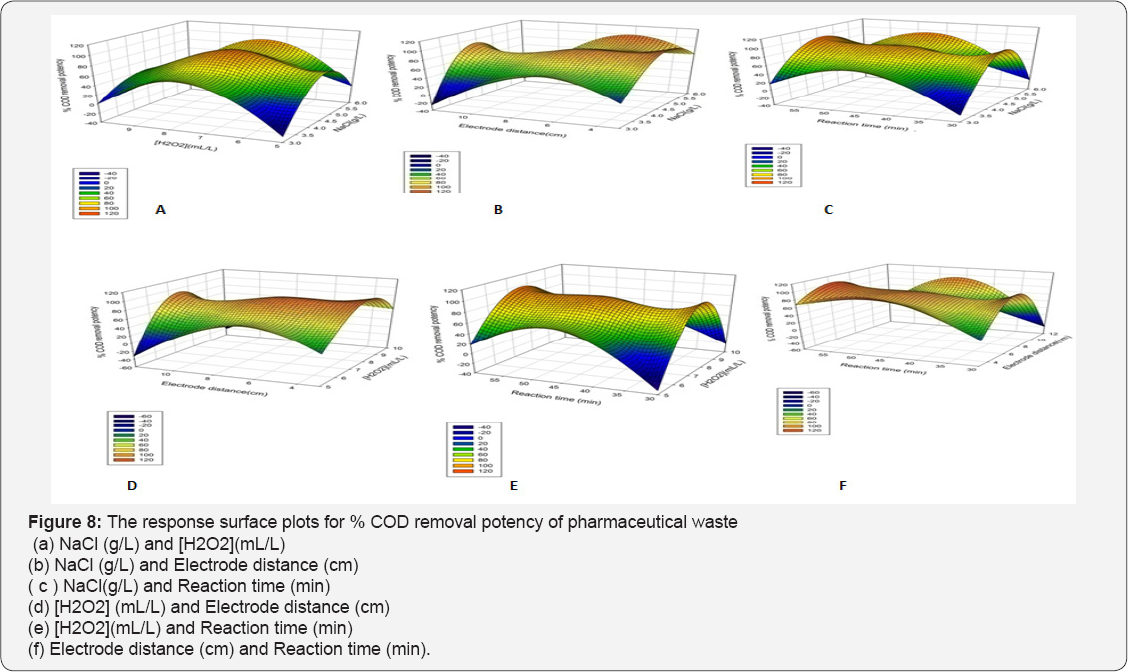
The effects of operational parameters on responses are shown by plotting the three dimensional (3D) and contour (2D) plots for the predicted responses. The plots are plotted by obtained data from polynomial model. The surface and contour plots of the quadratic model between two variables are drawn, and other factors are kept at center levels. The plots are shown in Figures 7 & 8. Response surface plots provide a methodology to predict the % removal for various values of the tested variables and therefore the contours of the plots facilitate in identification of the sort of interactions between these variables [17]. It is very simple to study the effects of factors on responses by surface plot as following.
Effect of Operational Parameters on %Drugs and COD Removal Potency
Effect of NaCl
It is reported that , the NaCl increases the EC efficiency because of the enhancement of the solution conductivity, providing a greater level of contaminants extraction , while the applied voltage cell is reduced, saving electric energy [34]. Even during the EC, the conductivity increased (mainly promoted by hydroxide ions electro-generated at the cathode, which is convenient for the process. It was observed that when NaCl amount was varied 3 to 6 g at [H2O2] 7.5 mL/L, Electrode distance 7.5 cm and electrolysis time 45 min a 41 % drug removal was enhanced , and also 35% increment in % COD removal potency. NaCl amount has significantly affected the response which is agreed from Pareto chart too.
Effect of Initial H2O2 Concentrations
The initial concentration of H2O2 plays an important role in the EF process. The increase in the removal efficiency was due to the increase in hydroxyl radical concentration as a result of the addition of H2O2. However, at a high dosage of H2O2, the decrease in removal efficiency was due to the hydroxyl radical scavenging effect of H2O2 and the recombination of the hydroxyl radical [31].
H2O2 + •OH •OOH + H2O (12)
•OOH + •OH H2O + O2 (13)
•OH +•OH H2O2 (14)
This can be explained by the impact of the additional produced OH• radicals that oxidize the drugs molecule , inflicting the maximum color removal [11]. The H2O2 concentration significantly poignant the drugs removal which is an agreement from Pareto chart too. When H2O2 concentration was inflated 5 to 10 mL/L , the concerns decolonization and % COD removal potency reduced up to 48 % and 34% at reaction time= 45 min , NaCl = 4.5g , electrode distance=7.5 cm. Selecting the applicable concentration of H2O2 is commercially affordable [36]. In addition, excess H2O2 dosages lead to the formation of less powerful •OH2 radicals.
It is important to optimize the amount of H2O2 in the Fenton method because the main cost of the method is the cost of H2O2, and excessive dose of H2O2 trigger adverse effects. The COD removal can be attributed to the fact that the system suffered both reactions simultaneously, electro coagulation and also Fenton process. The unutilized oxidant presented as excess amount of H2O2 also contributes to COD [37]. Thus, it becomes imperative to optimize the reagent ratio both for economical and environmental factors.
Effect of Electrode Distance
The 20% drugs removal was decreased when electrode distance was changed from 3 to 7.5 cm and % COD removal was remained unaffected at NaCl 4.5 g , [H2O2] 7.5 mL/L and electrolysis time 45 min. The Pareto chart analysis is showing that electrode distance has a significant impact on the responses. If the electrode spacing is too large, ohmic drop will occur through the electrolyte, which will lead to the reduction of cell voltage and power utilization [38,39] (Tables 7 & 8). On the other hand, at longer distance the mass transfer of ferric ion to the surface of cathode, which controls the regeneration ferrous ion, will get restrained [40]. The minimum distances between the electrodes should be chosen for low energy expenditures [41], but at very short electrode spacing, chances of short circuiting are very high. Therefore, an electrode spacing of 3 cm has been selected as the optimum for further experiments.


Effect of Electrolysis Time
The efficiency of contaminant reduction depends on Fe (III) production by the anode [35], so that high electrolysis duration would cause higher production of these iron hydroxides, which are in turn responsible for the coagulation process [33]. Reactive time influences the treatment efficiency of the electrochemical process [42]. Electrolysis time determines the production rate of Fe2+ or Fe3+ ions from iron electrodes. Moreover, COD removal may also involve electrochemical oxidation and adsorption by electrostatic attraction and physical entrapment.
Ferrous ion is the catalyst in the Fenton process. Its main purpose is the catalysis of hydrogen peroxide, resulting in hydroxyl radical formation. This is due to the fact that, Fe2+ plays a very important role in initiating the decomposition of H2O2 to generate the -OH in the Fenton process. When the concentrations of Fe2+ and -OH are high, Fe2+ can react with the -OH according to Equation (15).
Fe+2 + H2O2 Fe+3 + •OH +(15)
Hence, the excess ferrous ions consumed the OH- hydroxyl radicals with a high oxidative potential. It caused the ferric reduction efficiency to be lower than in Equation (8). However, it is not a good idea to use over high concentration of Fe2+. A large quantity of ferric oxide sludge will be generated, which needs further separation and disposal. An increase in the concentration of ferrous ion resulted in the increase in % drugs and COD removal potency. The color removal will increase as time increases particularly for lower initial dye concentrations. The reason is that at the initial irradiation stage of the process, hydroxyl radicals attack to the drugs molecules those results in increase of % drugs removal. The reactions of •OH and •O2H with drugs molecule result in the formation of intermediates. These intermediates in solution result in decrease in concentration of •OH that cause a decrease in %color removal. In addition, when reaction time was modified from 30 to 45 min at NaCl 4.5 g, [H2O2] 7.5 mL/L , electrode distance 7.5cm no change in % drugs and COD removal were observed .In oxidation processes, azo groups rapidly decompose and the solution becomes colorless. Naturally, longer time is required for the removal of aromatic rings. Therefore, COD removal is done in longer time compared with decolorization [43].
Kinetic Study
The second order kinetics model was utilized which are represented as follows Equation (16):

Electric Energy Consumption
Fixed cost of plant and operating cost contribute for total cost of an operation. Generally, operating cost analysis includes material and electrical energy costs as well as labor, maintenance, sludge dewatering, transportation and disposal costs. These cost items and fixed cost are independent of the type of the electrode material. Thus, the operating cost based on electrode material was calculated using the following equation.
It is clear that a technically efficient process must also be feasible economically. The major operating cost of EC is associated with electrical energy consumption during process. Electrical energy consumption was calculated using the Equation (17):
E = U I tEC (17)
Where E is the electrical energy in KWh, U the cell voltage in volt (V), I the current in ampere (A) and tEC is the time of EC process in hours [44-46]. The energy consumption at optimum values is 0.0198 KWh/dm3.
Occurrences
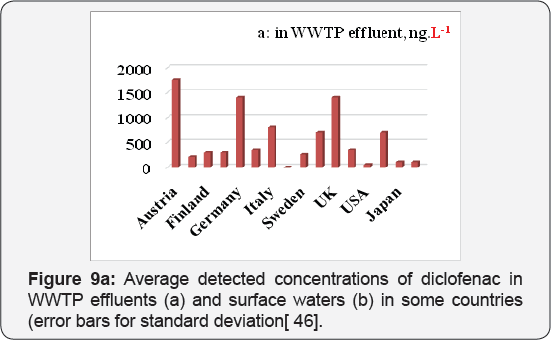
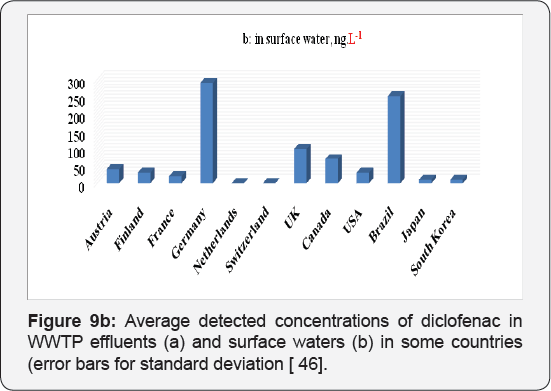
Due to their wide use, pharmaceuticals are expected to be present in WWTPs (Waste water treatment plants) where sewage systems are established. However, some of drugs are not effectively removed by the WWTPs and subsequently find their way to water bodies. Diclofenac, as discussed above, is example of drug that are poorly removed by WWTPs. It has been detected in WWTP effluents, surface waters, and ground water and occasionally in drinking water, with cascading concentrations due to dilution and some elimination processes like soil retention and photo transformation. They have been detected in Europe, America and Asia. The average detected values in WWTP effluents and in surface waters in some countries have been summarized in Figures 9a & 9b. All concentration data was collected from available publications. The majority of surface water data in the figure is from rivers with a few from lakes and estuaries; however, the occurrence of both drugs in groundwater and drinking water is inadequate in the literature and is therefore not presented in this figure. The concentrations of diclofenac is significantly different among countries as shown in Figures 9a & 9b . One explanation for this difference is the diverse consumption rates of both pharmaceuticals in those countries. Another explanation is that the higher concentrations in some countries might not be found yet due to the insufficient investigations conducted so far.
Ecotoxicology
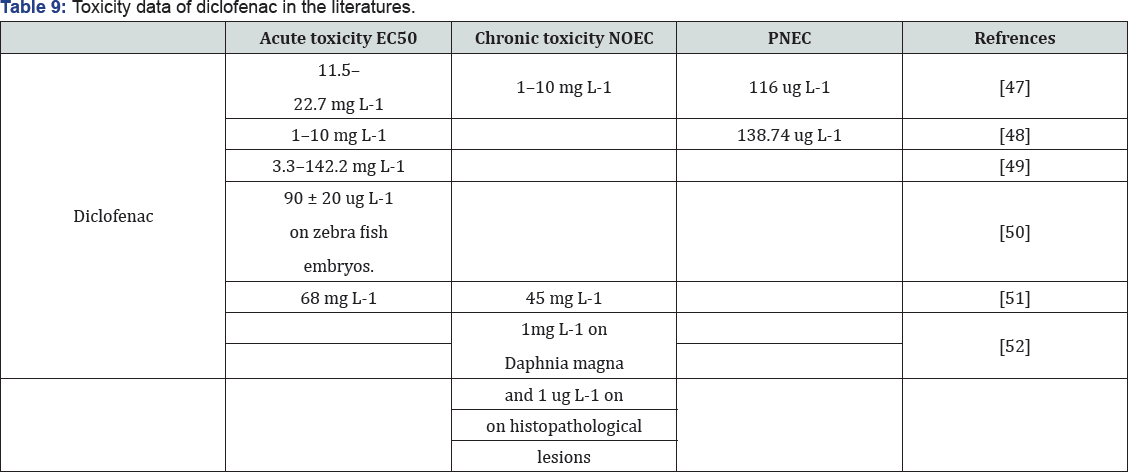
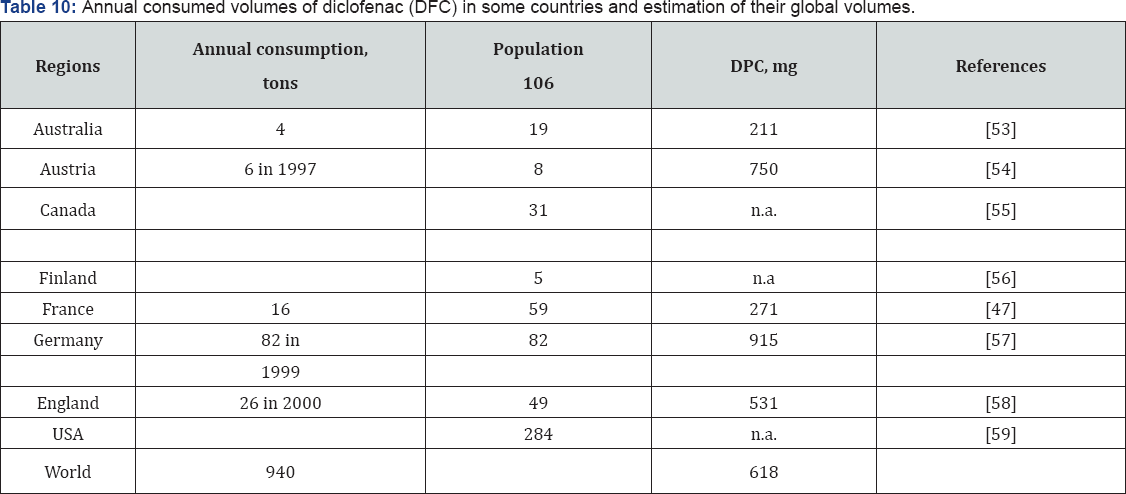
Diclofenac are widely present in water bodies. Therefore, it is necessary to evaluate their impact on the ecosystems where they are present. Many studies have assessed their ecotoxicology (Table 9). Ferrari et al. [47], studied the toxic effects of diclofenac on bacteria, algae, micro crustaceans, and fish. They observed that both substances had a relatively limited acute ecotoxicity on the tested organisms. In the worst cases of acute toxicity tests, concentrations that cause 50% of effect (EC50) were 13800 ug L-1 for 11454 ug L-1 for diclofenac on the Microtox _ system over 30 min [48-62]. However, chronic tests displayed higher toxicity than acute tests. In the chronic toxicity tests, the worst cases of no observed effect concentrations (NOEC) were 25 ug L-1 for carbamazepine and 246 ug L-1 for diclofenac on B. calyciflorus over 48 h. Later, Cleuvers [63,64] demonstrated the synergistic toxicity of diclofenac, ibuprofen, naproxen, and acetylsalicylic acid. The mixture toxicity of those substances at the EC50 and EC80 doses was as high as or even higher than that predicted by concentration addition. Dietrich and Prietz [63] investigated the lethality and teratogenicity of diclofenac on zebra fish embryos after a 96 h exposure and reported that the lethal concentration of diclofenac is 480 ± 50 lg L_1 (LC50/96 h) and the effect concentration is 90 ± 20 ug L-1 (EC50/96 h). In chronic toxicity tests of Daphnia.
Magna reproduction, the NOEC of diclofenac was reported to be 1mg L-1 and the LOEC (lowest observed effect concentration) to be 0.2 mg L-1 Schwaiger et al. [66]. In order to evaluate sub lethal toxic effects of diclofenac on fish, Schwaiger & Triebskorn et al. [65,66] studied rainbow trout (Oncorhynchus mykiss) exposed to diclofenac in doses ranging from 1 ug L-1 to 500 ug L-1 over a period of 28 days. Histopathological examinations of exposed fish revealed alterations in the kidney and gills. The lowest observed effect concentration (LOEC) causing renal lesions and alterations of the gills was found to be 5 ug L-1 Schwaiger et al. [65]. Schwaiger et al. [66] also observed the bioaccumulation of diclofenac in fish. The highest concentrations of diclofenac were detected in the liver, followed by the kidney and then the gills. Its bioconcentration factors (BCF) were calculated as 12-2732 in the liver, 5-971 in the kidney, 3-763 in the gills, and 0.3-69 in the muscle.
Triebskorn et al. [66] found that the cytological alterations in liver, kidney and gills occurred even at diclofenac concentration of 1 ug L-1. Comparing those results with the detected concentrations in (Figure 4) diclofenac definitely poses a risk on the ecosystems where it is present. Pharmaceutical residues may be transported through food chains and severely harm other species. Studies have related the decline of the population of vultures in the India subcontinent to their exposure to diclofenac residues Green et al. [67]. Vultures used to be a common raptor in the region; however, the raptor's population has declined significantly since the 1990s. These studies found that diclofenac residues in treated livestock bodies that were scavenged by the vultures caused the renal failure and death of the vultures. Based on knowledge obtained so far, it seems that the acute ecotoxicity of both drugs is rather unlikely, but that the chronic effects are still not clear. Long term studies are needed for the better characterization of chronic ecological effects. The synergistic toxicity of these drugs with other compounds also needs more studies. Furthermore, information on the ecological effects of their metabolites and intermediates is also needed.
Metabolism
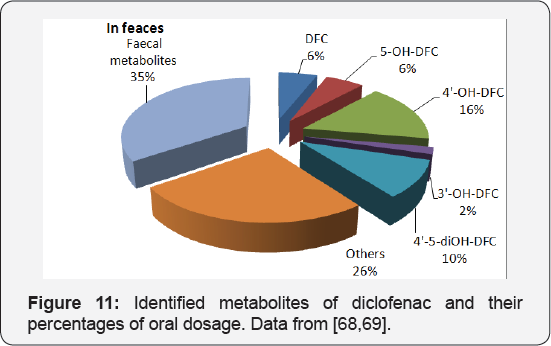
After administration, some prescribed drugs aren't utterly metabolized. The un metabolized parent medication and a few metabolites area unit later excreted from the body via urine and faces. In places with sewage systems, these pharmaceutical residues enter the WWTP Siva waste. Diclofenac isa nonsteroidal antiinflammatory (NSAID) accustomed reduces inflammation and to alleviate pain working as an analgesic in conditions like in inflammatory disease or acute injury. It also can be used to reduce menstrual pain, dysmenorrhea. Once oral administration, diclofenac is eliminated during a short period (elimination 0.5 life concerning a pair of h [60]. Approximately 65% of the dosage is excreted through urine in which six metabolites have been identified. However, the actual amount of metabolites in the faeces is still not clear. The mass balance of diclofenac metabolism is shown in (Figure 10).
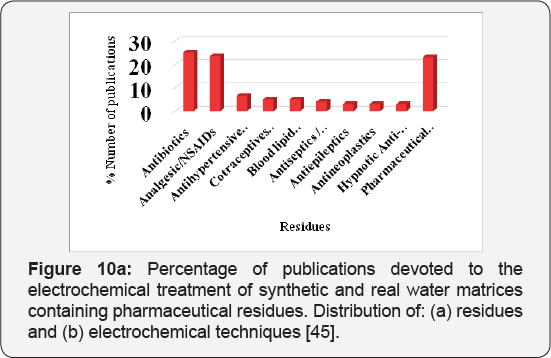
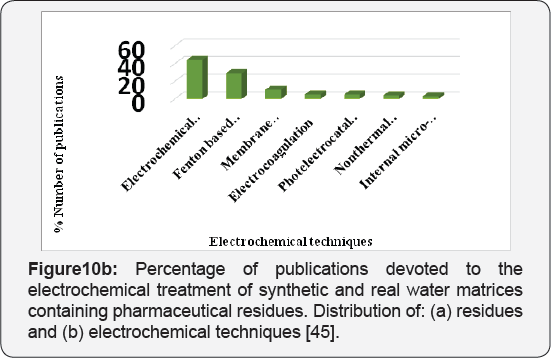
At least two of the metabolites in urine are discharged at higher rates than unchanged diclofenac. However, diclofenac is also available in other forms for dermal applications, eye dropping and injection. In principle, those different forms of the drug should produce same metabolites, but in different proportion [61]. Oral application is the main form of administration and accounted for about 70% of the worldwide diclofenac sales in 2007 (IMS Health). The dermal application of diclofenac, which is popular in developed countries, may reduce the bioavailability of the drug to roughly 50% by circumventing the biotransformation in the liver: a process called the first pass effect or presystemic metabolism. Therefore, the dermal application of diclofenac could result in greater diclofenac discharges into the aquatic environments [62-69]. Many investigations detected diclofenac in water bodies. Nevertheless, no studies have been conducted on the behavior of diclofenac metabolites in water circles (Figure 11).
Conclusion
The study was successfully carried out for the % drug and COD removal of simulated pharmaceutical effluent. The effects of the process-specific variables were investigated, using a 5-level central composite design (CCD) , and response surface methodology (RSM) employed for process optimization. Quadratic regression models were developed that showed a satisfactory fit between the predicted and experimental values for both drug and COD percent reduction. The conclusion from this study has been drawn that CCD can be effectively optimized the process variables for the treatment of effluent at laboratory and industrial scale. Effect of experimental parameters on the drug removal efficiency was established by the response surface and contour plots of the model-predicted responses. The residuals follow a normal distribution. The electrical energy consumption for EF process was calculated .The low consumption of the Fenton's reagents implies that the process is cost efficient with low generation of residues. According to the results obtained, it can be concluded that the EF process using iron electrodes for drug degradation and remediation of wastewater, can be a promising process in terms of environmental and economical features. The results suggested that EF process is an economically viable and feasible process for future applications. Further studies on pharmaceutical waste is continued by using different heterogeneous photo catalyst.
For more Open Access Journals in Juniper
Publishers please click on: https://juniperpublishers.business.site/
For more articles in Open
Access Journal of Environmental Sciences & Natural Resources please
click on: https://juniperpublishers.com/ijesnr/
To know more about Open
Access Journals Publishers
To read more…Fulltext
please click on: https://juniperpublishers.com/ijesnr/IJESNR.MS.ID.555623.php


Comments
Post a Comment