Simulation of Extreme Dry and Wet Spells in Brahmaputra Basin Using K-Nearest Neighbour Model-Juniper Publishers
Juniper Publishers- Open Access Journal of Environmental Sciences & Natural Resources
Simulation of Extreme Dry and Wet Spells in Brahmaputra Basin Using K-Nearest Neighbour Model
Authored by Mohammed Sharif
Abstract
This paper describes the application of a K-nearest neighbour (KNN) weather-generating model that allows re sampling with perturbation of the observed data to simulate
a) Observed maximum temperature, minimum temperature and precipitation;
b) Duration of extreme wet spells; and
c) Duration of extreme dry spells at ten climate stations in the Brahmaputra River Basin.
The duration of extreme dry and wet spells were extracted from the 800 years of daily precipitation simulated by the K-NN model. The results of the simulation of extreme dry and wet spells carried out by the K-NN model clearly indicated that the model generated unprecedented extreme events that were not seen in the observed record. Such events are a critical input to flood management and crop production models. The model generated several extreme dry spells that are important for evaluation of effective drought management policies for the basin. Owing to the ability of the model to simulate extreme dry and wet spells, the analysis conducted herein has the potential for providing valuable aid in developing efficient flood and drought management strategies for the Brahmaputra basin. It may be concluded that the utility of flood prediction models in estimating the probability of extreme events may be greatly enhanced if their performance is evaluated based on synthetic sequences generated in the present research.
Keywords: Brahmaputra, Weather, K-NN, Model, Precipitation
Introduction
Global climate is expected to change significantly due to the continually increasing levels of carbon dioxide and other greenhouse gases. By the year 2056 the CO2 concentration in the atmosphere is likely to double [1]. The future projections of climate change indicate a global average warming of between 1.5° to 4.5° C, greater surface warming at high latitudes in winter, but less during the summer. An increase of 3 to 15 % in global precipitation is expected, mainly due to globally increasing temperature, which causes greater evaporation of sea surface water. A year-round increase in precipitation in high-latitude regions is expected, whilst some tropical areas may experience small decreases. One of the most important and immediate effects of increased greenhouse gas emissions is the rise in longterm average temperatures. Consequently, many aspects of the natural environment, including water resources are likely to be adversely impacted by the warming of the atmospheric system.
Due to increase in average surface air temperature, the hydrological cycle is likely to become vigorous. Consequently, the precipitation and runoff patterns are expected to be altered. One of the most important and immediate effects of global warming would be the changes in local and regional water availability [2]. Changes in extreme precipitation events will likely alter runoff patterns, and would lead to increase in the frequency and magnitude of extreme events (IPCC 2014). As a result, hydrological systems are anticipated to experience not only the changes in the average availability of water but also changes in the extremes [2,3]. Therefore, simulation of weather data under plausible scenarios of climate change is required for the evaluation of hydrologic impacts of extreme events at basin scale.
Literature Review
Recently, weather generators have been employed for simulation of weather data. Weather generators are stochastic models capable of simulating historical and future climatic conditions on a daily time scale either at a single or multiple sites Bardossy and Plate, 1991; Hutchinson 1995. An important advantage of weather generators is that they allow simulation of synthetic series of meteorological variables that are long enough to be used in the assessment of risk in hydrological or agricultural applications. Weather generators have been employed in climate change impact studies to generate scenarios with high temporal and spatial resolutions based on the output from GCMs [4,5]. An important class of nonparametric weather generators are those based on the K - Nearest neighbor (KNN) resembling approach. Successful applications of K-NN weather generators to simulation of weather data have been described by Rajagopalan and Lall [6], Buishand and Brandsma [7] and Yates et al. [8] among others. Sharif and Burn [9] describe an improved KNN weather generator for simulating plausible climate change scenarios in the Upper Thames River basin, Canada.
Muluye [10] describes the application of six variations in a nearest neighbour resampling approach to downscale station daily precipitation and minimum and maximum temperature fields for the Chute-du-Diable meteorological station in north eastern Canada. Gangopadhyay et al. [11] proposed a new K-NN algorithm that incorporated a principal component analysis [12]. Most of these applications have focused on resampling the observed data without simulating extreme events not observed in the historical record. A major limitation of these models is that they merely reshuffle the historical data to generate synthetic weather data without producing new values. Use of synthetic sequences simulated by such weather generators, in conjunction with hydrological models, to catchment response evaluation could lead to under-exploration of the possible effects of climate variability. To overcome this problem, Sharif and Burn [9] developed an improved K-NN model that can simulate large number of unprecedented values of variables and extreme events not seen in the observed record while preserving important statistical properties of the observed data.
Study Area and Data
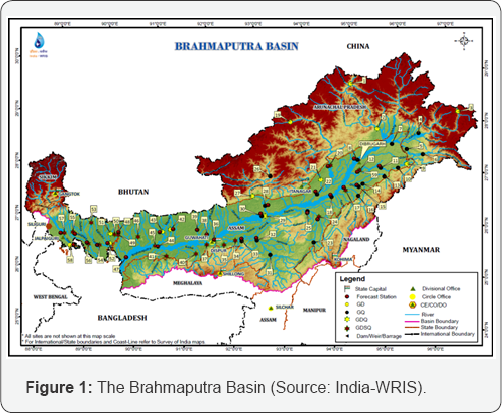
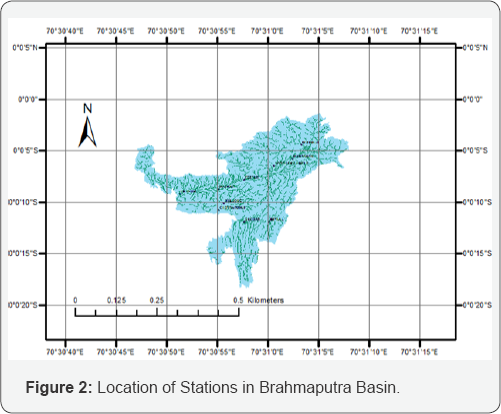
The Brahmaputra basin spreads over Tibet (China), Bhutan, India and Bangladesh, and has a total catchment area of 580000 km2. The schematic of the basin is shown in (Figure 1) In India, it spreads over the states of Arunachal Pradesh, Assam, West Bengal, Meghalaya, Nagaland and Sikkim and lies between 88°11' to 96°57' east longitudes and 24°44' to 30°3' north latitudes and extends over an area of 1,94,413 km2 which is nearly 5.9 % of the total geographical area of the country. It is bounded by the Himalayas to the north, by the Patkari range of hills on the east running along the India-Myanmar border, by the Assam range of hills on the south and by the Himalayas and the ridge separating it from the Ganga basin on the west. The Brahmaputra River originates in the north from Kailash ranges of the Himalayas at an elevation of 5150 m just south of the lake called Konggyu Tsho and flows for about a total length of 2,900 km. In India, it flows for a length of 916 km. The principal tributaries of the river joining from the right are the Lohit, the Dibang, the Subansiri, the Jiabharali, the Dhansiri, the Manas, the Torsa, the Sankosh and the Teesta whereas the Burhidihing, the Desang, the Dikhow, the Dhansiri and the Kopili joins it from the left. The major part of the basin is covered by forest accounting for 55.48% of the total area and 5.79% of the basin is covered by water bodies. The basin spreads over 22 parliamentary constituencies (2009) comprising 12 of Assam, 4 of West Bengal, 2 of Arunachal Pradesh, 2 of Meghalaya, 1 of Sikkim and 1 of Nagaland. Figure 2 shows the location of ten climate stations in the Brahmaputra basin.
Climate Data
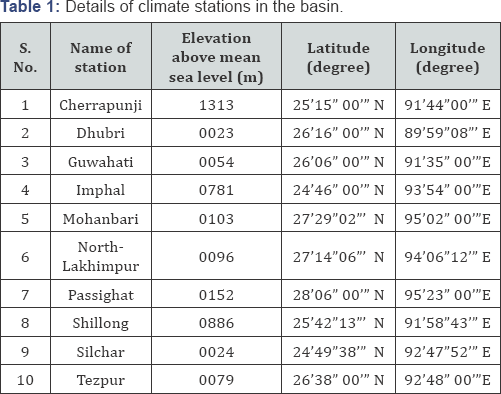
Hydrological observations in the sub-basin are carried out by the Central and State Governments. The Central Water Commission maintains 108 hydrometric sites in the basin. In addition, gauge data at 80 sites, gauge-discharge data at 15 sites and gauge, discharge and sediment data at 25 sites is maintained by the State Governments and the Brahmaputra Board. The Central Water Commission operates 27 flood forecasting stations in the sub-basin. The daily maximum and minimum temperature and daily precipitation data for the present research were obtained from India Meteorological Department (IMD) through the Indian Institute of Technology (IIT), Guwahati. Details of climate stations in the basin are presented in Table 1. The data pertaining to monthly average temperature and total monthly precipitation at each of the 10 stations has been downloaded from the website of IMD.
Research Objectives
The major objective of the present research was to simulate extreme dry and wet spells at several locations in Brahmaputra River Basin using an improved weather generating model based on K-NN algorithm. Additionally, the K-NN model was employed to simulate synthetic sequences of observed climate data in the basin. The improved K-NN model is applied to simulate daily weather data using the resampled historical data set as the driving dataset for the K-NN model. The intent is to simulate a variety of extreme dry and wet spells that could be profitably utilized for modelling flood generation mechanism in the basin. Through the simulation of extreme unprecedented wet and dry spells, the utility of crop production models in estimating crop yields can also be enhanced.
Methodology
The improved K-NN weather generating model [9] was applied to perform a series of simulations at ten stations in the Brahmaputra basin. A K-NN algorithm typically involves selecting a specified number of days similar in characteristics to the day of interest. One of these days is randomly resampled to represent the weather of the next day in the simulation period. Despite their inherent simplicity, nearest neighbour algorithms are considered versatile and robust. These methods have been intensively investigated in the field of statistics and in pattern recognition procedures that aim at distinguishing between different patterns. The nearest neighbour approach involves simultaneous sampling of the weather variables, such as precipitation and temperature. The sampling is carried out from the observed data, with replacement. To simulate weather variables for a new day t+1, days with similar characteristics as those simulated for day t are first selected from the historical record. One of these nearest neighbour is then selected according to a defined probability distribution or kernel and the observed values for the day subsequent to that nearest neighbour are adopted as the simulated values for day t+1.
Three different types of simulation were conducted in this research. The first simulation was carried out to reproduce the statistical characteristics of the historical data. The intent behind performing simulation 1 was to assess the effectiveness of the K-NN model in reproducing the important statistical attributes of the historical data while perturbing the individual observed data points. For this purpose, a new subset of years that constitute the driving data for the model was obtained by using an integer function that returned integers between the specified upper and lower bounds. To obtain the driving data set for the model consisting of N (here N =34) years, the integer function was queried N times. With this method, each year has an equal empirical probability of being selected. In practice, some years may be selected more than once, while other years may not be selected at all. The improved K-NN model is then run to simulate 800 years of weather data, and the performance of the model is evaluated through comparing the simulated data with the historical data using the boxplots. Simulation 2 was conducted to simulate extreme wet spells, whereas simulation 3 was used to simulate extreme dry spells at 10 different stations in the basin. With the aim to interpret the data in a clear and concise manner, the simulation results have been presented for two stations only, namely Cheerapunji and Guwahati.
Simulation Results
For each simulation box plots have been used to present the statistics of interest. Box plots are a favored method of data analysis in many hydrological applications as they show the range of variation in statistics of simulations and provide a straightforward method of comparing the statistics of simulations with historical data. The bottom and top horizontal lines in the box in a box plot indicate the 25th and 75th percentile, respectively, of the statistics computed from the simulated data. The horizontal line within the box represents the median. The whiskers are lines extending from each end of the box to show the extent of the rest of the data. The whisker extends to the most extreme data value within 1.5 times the inter-quartile range of the data. The values beyond the ends of the whiskers are called outliers and are shown by dots. The statistics of the historical record are represented by dots and joined by solid lines.
Simulation 1: Reproduction of Historical Statistics
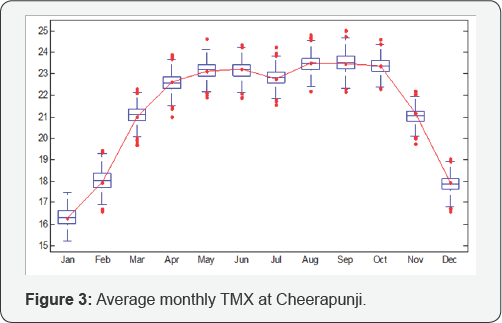
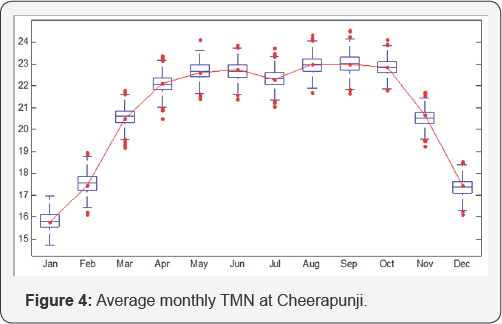
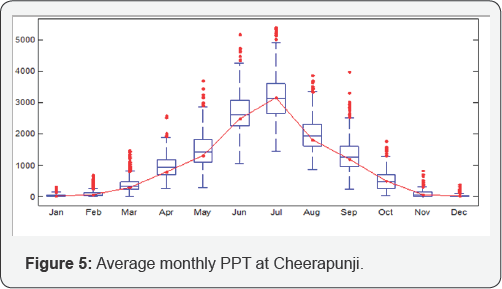
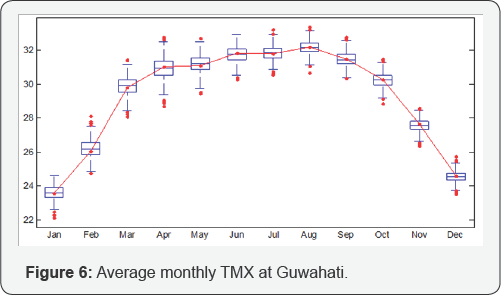
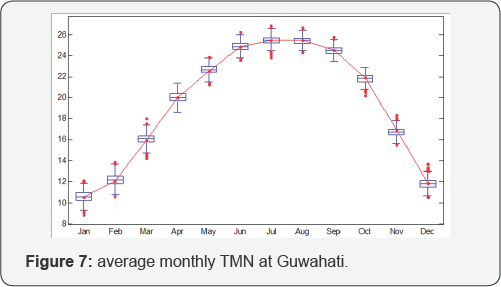
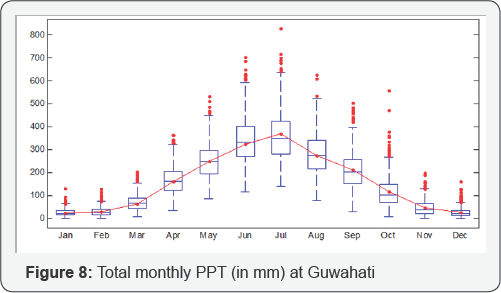
The purpose of simulation 1 was to analyze the performance of the improved model in reproducing various statistical attributes of the observed data, while perturbing the observed data points. Figure 3 shows box plots of simulated values of mean TMX at Cheerapunji. The historical mean values are shown by the dots in the boxplots. It can be seen from (Figure 3) that the model adequately reproduced the historical values, which is highly satisfactory given that monthly statistics are not explicitly specified in fitting the K-NN model. The boxplots of TMN at Cheerapunji are shown in Figure 4 whereas Figure 5 provides box plots of total monthly precipitation at Cheerapunji. Figures 6 & 7 show the boxplots of simulated values of TMX and TMN at Guwahati, respectively. The simulated total monthly precipitation at Guwahati is shown in Figure 1-8. In each of the boxplots shown in Figures 3-8, the median of the simulated data is very close to the historical means. It can, therefore, be concluded from these boxplots that the historical mean is well preserved for TMX, TMN, and also for monthly precipitation. With several values lying above the whiskers, the inter-annual variability in the simulated data is quite evident from the box plots presented in (Figures 3-8) However; the inter-annual variability is quite high in the simulated precipitation compared to the temperature data. Overall, the performance of the model in reproducing the monthly precipitation totals as well as average monthly TMX and TMN was satisfactory at all the stations in the basin.
Simulation2: Wet Spells
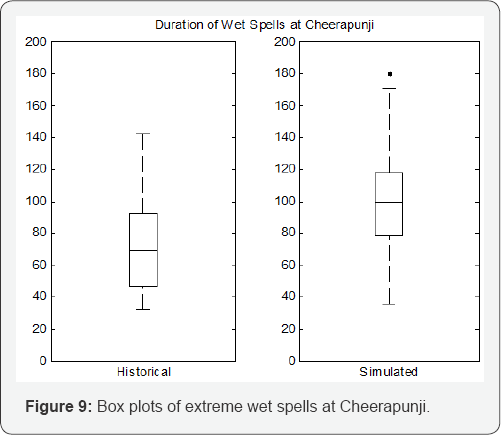
Analysis of statistics of wet spells is important as it gives an indication about the ability of the model to reproduce the persistence structure of the underlying data. For each year in the historical and simulated series, the most extreme spell of wet days is determined. Thus, boxplots were created using 32 values for the historical data and 800 values for the simulated data. (Figure 9) shows the distribution of the extreme wet spells for the historical as well as the simulated data at Cheerapunji. For the historical data, the median of wet spells duration was around 65 days, whereas it was around 100 days for the simulated data. As expected, the median of the simulated data is substantially higher than the median of the historical data. A single extreme wet spell with a duration of around 180 days was simulated. This extreme spell lies beyond the whiskers which are at 1.5 times the inter-quartile range of the simulated data. Such extreme spells are particularly crucial for the analysis of flooding events in the basin.
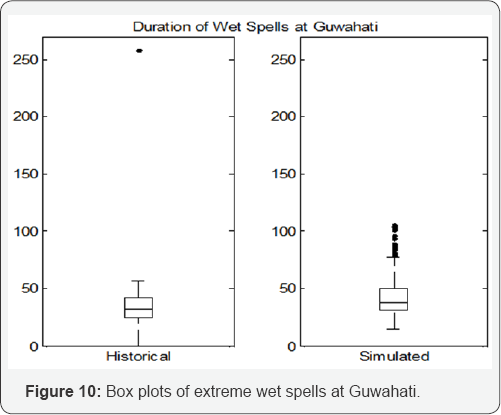
For Guwahati, which has a substantially smaller annual average precipitation and wet days compared to Cheerapunji, the simulations produced relatively smaller median. The median of the historical data was of the order of 30 days for the historical data, whereas it was around 40 days for the simulated. This was expected as the improved model tends to perturb the data points to produce values that are not present in the observed record. The boxplots for the duration of extreme annual wet spells at Guwahati are shown in Figure 10. At Guwahati, several events beyond the whiskers were produced by the KNN model with the most extreme event being of the order of 100 days.
Simulation3: Dry Spells
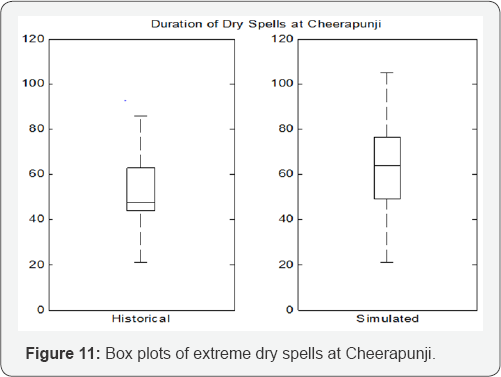
It is important to determine dry spell characteristics of the simulated data in order to assess the risks associated with drought in the basin under future climatic conditions. (Figures 10 & 11) presents box plots of the total number of days during extreme dry spells in each year of the observed as well as simulated record. The first box plot in (Figure 11) presents the distribution of extreme dry spells computed from 32 years of observed data, whereas the second boxplot is based on 800 years of simulated data. As can be seen from the box plot in (Figure 11), the median dry spell duration for the observed data is 46 and the corresponding statistic in the simulated data is 65. The higher median value produced by the KNN model may be attributed to the nature of the improved model, which tends to produce more severe events than observed in the historical data. However, unlike the wet spells no dry spells with durations exceeding 1.5 times the inter-quartile range were simulated by the model. As in the case of wet spells, the model simulated several events that are more severe than present in the observed data, thus providing a wider range of events as input to a hydrologic model.
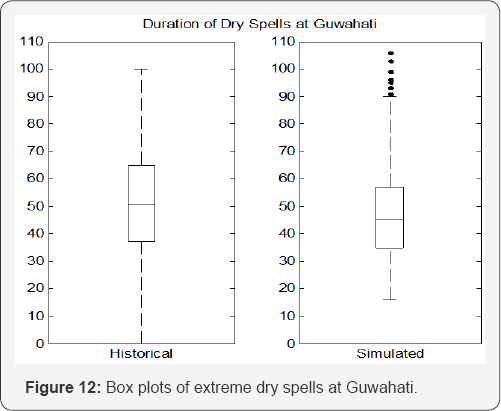
The boxplots of dry spells at Guwahati for the historical and simulated data are shown in (Figure 12). For the historical data, the median dry spell duration was around 50 days, whereas it was slightly less than 50 days for the simulated data. The KNN model was able to simulate several events with durations exceeding 90 days. Use of weather sequences simulated by theKNN model would lead to better reliability in assessing the vulnerability of the basin to drought events. An encouraging aspect of the model used herein is that extreme unprecedented events, both low precipitation and high precipitation, can be simulated. This allows for evaluation of the response of rainfall- runoff models for a wide variety of simulated extremes.
Conclusion
With the improved K-NN model, a series of unprecedented dry spells that were not seen in the historical record were produced. The incorporation of such extreme spells as an input to the hydrological model would increase the reliability of simulation of flooding events in the basin. As in the case of wet spells, the model simulated several events that are more severe than present in the observed data, thus providing a wider range of events as input to a hydrologic model. The results presented in this research clearly indicate that the model produced extreme dry spells more severe than those observed in the historical record. It is clear from the results of simulation of dry spells that greater variability is associated with sustained periods of precipitation and dry days than is present in the observed data. It can be concluded that the use of weather sequences simulated by the KNN model would lead to better reliability in assessing the vulnerability of the basin to drought events. A distinguishing feature of the weather sequences simulated herein is that a variety of extreme wet and dry spells have been generated, which allows for evaluation of the response of the hydrological and crop production models for a wide variety of simulated extremes.
Given the adverse impact of hydoclimatic extremes in the current climate, management of climate-related risks requires comprehensive analysis of future extremes. Changes in the total amount of precipitation - its frequency and intensity - when on the surplus side would affect the patterns of surface runoff, but would create drought like situations when on the deficit side. Therefore, in this research simulation of duration of wet and dry spells has been carried out using an improved KNN model. The intent was to generate extreme weather data, which can be effectively utilized in conjunction with a hydrological model for the evaluation of flooding and drought events in the basin. The strength of the improved model applied here lies in the simulation of extreme dry and wet spells that are unprecedented, and were not seen in the available observed precipitation record. The research conducted herein has the potential to plan and implement effective flood management strategies in the Brahmaputra basin.
For more articles in Open Access Journal of Environmental Sciences & Natural Resources please click on: https://juniperpublishers.com/ijesnr/index.php




Comments
Post a Comment