Development of pre harvest forecasting model for Chhattisgarh plain Zone on Pigeonpea by Principal Component Analysis- Juniper Publishers
Juniper Publishers- Open Access Journal of Environmental Sciences & Natural Resources
Development of pre harvest forecasting model for Chhattisgarh plain Zone on Pigeonpea by Principal Component Analysis
Authored by Gaind lal
Abstract
The present investigation deals with the model have been also developed by Principal Component Analysis on districts level and zone level as well. Models fitted with 2 Principal Components (PC1 and PC2) and Time trend (T). Models are highly significant and R2 value 69% for Pigeonpea and for CG plain Zone is also highly significant at 0.1% level of significance. The present investigation covers under the study of individual effect of weather variables, joint effect of weather variables forecasting model developed through stepwise regression technique following the concept of older studies by the different scientists in this direction for many crops. The principal component analysis has been also taken for the development of forecasting model. But in this section only Principal Component Analysis covered for the model development.
Keywords: Pigeonpea; Coefficient of determination; Principal component Analysis
Introduction
Forecast of the crop production at suitable stages of crop period before the harvest are vital for rural economy. On the other hand, forecasts of crop yields are important for advance planning formulation and its implementation. Forecasting is also vital for crop procurement, distribution, price structure and import export decisions etc. These are useful to farmers to decide in advance their future prospects and course of action. Thus, reliable and timely pre-harvest forecasting of crop yield is very important. To meet such needs, crop forecasts under the prevalent system in India are being issued by the Directorate of Economics and Statistics, Ministry of Agriculture, New Delhi. The final estimates based on objective crop-cutting experiments are of limited utility as those become available quite latter after the crop harvest. The Statistical techniques employed for forecasting purposes should be able to provide objective, consistent and comprehensible forecasts of crop yield with reasonable precisions well in advance before the harvest. Several studies have been carried out to forecast crop yield using weather parameters etc. These are useful to farmers to decide in advance their future prospects and possible course of action. Thus, reliable and timely pre-harvest forecasting of crop yield is very important. In statistical model approach, one or several variables (representing weather or climate) are related to crop responses such as yield and yield contributing characters. Therefore, there is a need to develop area specific forecasting models based on time series data to help the policy makers for taking effective decisions to counter adverse situations in food production. The forecasting of crop yield may be done by using three major objective methods
a. Biometrical characteristics
b. Weather variables and
c. Agricultural inputs [1].
Material and Methods
The present investigation covers under the study of individual effect of weather variables, joint effect of weather variables forecasting model developed through stepwise regression technique following the concept of older studies by the different scientists in this direction for many crops. The principal component analysis has been also taken for the development of forecasting model. Time series data on yield for 25 years (1990-91 to 2014-15) for 4 Districts, Seventeen year for 5 districts has been procured from Directorate of Agricultural, Govt. of Chhattisgarh. The weekly meteorological data (199091 to 2014-15) procured from IGKV, Raipur for Chickpea and Pigeon pea crop period data.
PCA is a multivariate technique for data reduction. It is a mathematical function, which does not require user to specify the statistical model or assumption about distribution of original variables [2]. Let Xij be the value of jth biometrical character (j= 1, 2, ...p) corresponding to ith varieties of experiment ( i= 1, 2,...n). The PCA for xij's will be carried out. Let PC1, PC2, ....PCK be first K (K< P) principal components explaining variability about more than 70 to 90 percent of the total variation in xij's. Using these K principal components as regressed variables and varieties yield (yi) as regressed, the following linear multiple regression model for pre-harvest forecast of crop yield has been proposed.

Where Yi is the crop yield of the it plot; p0, pi, p2 pk are model parameters and ei is error term assumed to follow independently normal distribution with mean 0 and variance a2. The aforesaid model is fitted with the data by least square technique.
a)Measures for validation and comparison of the models
Two procedures have been used for the comparison and the validation of the developed models. These procedures are given bellow. Coefficient of determination (R2) and (R2adj). The models were validated on the basis of (R2) and (R2adj) which can be computed from the formula given by Drapper and Smith (1988).Adjusted R2 is given by the following formula,

Where ssres/ (n-p) is the residual mean square and sst/ (n- 1) is the total mean square. The total mean square is constant regardless of how many variables are in the model. On adding a regressed in the model Adjusted R2 increases only if the addition of the regressed reduces the residual mean square. It also penalizes for adding terms that are not helpful, so it is very important in evaluating and comparing the regression models.
b)Percent Deviation
The plants to be measured were selected randomly .Plant height was taken from the top of soil to the peak of plant with measuring tape.
The formula for computation of Percent Deviation of forecast yield from actual yield is given by [3,4]. This measures the deviation (in percentage) of forecast from the actual yield data. The formula for calculating the percent deviation of forecast is given below:

Results and Discussion
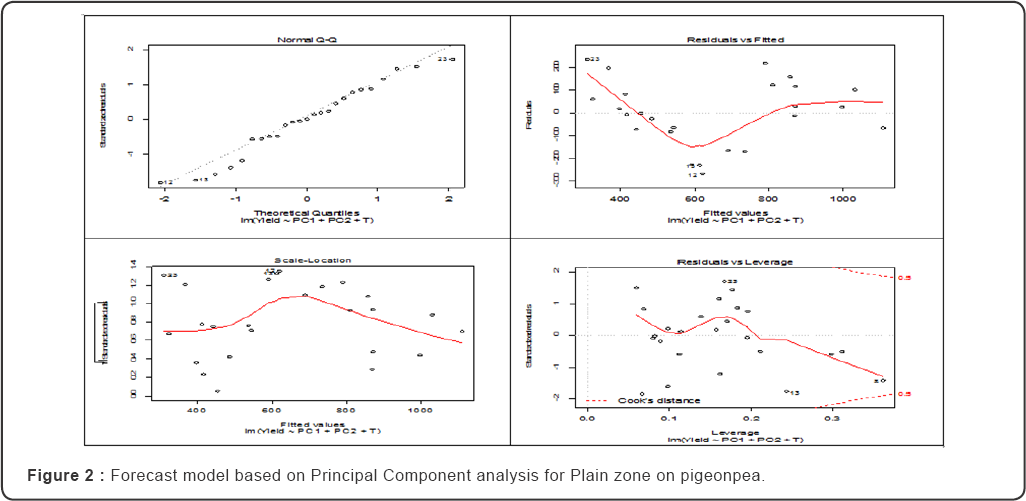
The Principal Component PC1, PC2 and T fitted finally in the model in given below: Y= -60.02 -2244.8 PC1-4493.58 PC2-22.50 T. The results given in Table 1 that all variables (PC1, PC2 and T), all the variables are found significant [5-8]. The coefficient of determination adjusted (R2) has been found to be 85 % which is significant at 0.01% level. Table 2 Indicates that the value of adjusted R2 good enough i.e. 85% (Figures 1 & 2). Deviation from yield indicates that the model is best fit and it has high power to pre-harvest forecast. It means model is very reliable for forecasting at zone level for pigeonpea [9-11].

***P<0.001, **P<0.01,*P<0.05, +P<0.1.

***P<0.001, **P<0.01, *P<0.05, +P<0.1.


For more articles in Open Access Journal of Environmental Sciences & Natural Resources | Juniper Publishers please click on: https://juniperpublishers.com/ijesnr/index.php


Comments
Post a Comment