Impact of Various Levels of Phosphorus on Wheat (CV.PIRSABAK-2013) - Juniper Publishers
Juniper Publishers- Open Access Journal of Environmental Sciences & Natural Resources
Impact of Various Levels of Phosphorus on Wheat (CV.PIRSABAK-2013)
Authored by Sajid Islam
Abstract
An experiment was conducted at Cereals Crops Research Institute Pirsabak Nowhere on 'Impact of various levels of phosphorus on Wheat (cv. PIRSABAK-2103) during winter 2014-15. The experiment consisted of single factor i.e. phosphorus levels 0, 45, 60, 75 and 90 kg ha-1. The experiment was carried out in simple randomized complete block (RCB) design, having three replications. Sub plot size was 5m x 1.8m. Row to row distance was kept as 30 cm. Agronomical treatments were kept the same for all the plots. Leaf area tiller-1, days to heading, days to physiological maturity, plant height, spikes m-2, spike length, grains spike-1, thousands grains weight, biological yield and grain yield were significantly (p<0.05) affected by various levels of phosphorus. Maximum weight of thousand grains (41.8g) was recorded from plots applied with 75 kg P2O5 ha-1 while the plots that received phosphorus at the rate of 90 kg ha-1 produced maximum leaf area tiller-1 (128.3 cm2), days to heading (129), days to physiological maturity (166), plant height (92.6 cm), number of spikes meter-2 (363), spike length (11.8 cm), number of grains spike-1 (45), biological yield (13056 kg ha-1) and grain yield (3991 kg ha-1). It is concluded that phosphorus application at 90 kg ha-1 showed best performance
Introduction
Wheat (Triticum aestivum L.) is one of the important staple food and widely cultivated leading cereals crop both in acreage and in production among the grain crops of the world. More than one-third of the world population is feed by wheat. Pakistan occupies supreme position in food grains and is one of the important wheat producing countries in the world. A grain of wheat is directly or indirectly consumed as human diet and straw used as animal feed. Reduction in wheat production severely affects the economy of the country. In Pakistan wheat is major staple food which fulfills main dietary supplies, provides about 73% of the calories and protein of the average diet, Heyan, 1987.
In Pakistan wheat crop cover 8549.8 thousand ha, which produced 24033 thousand tones with mean production of 2657 kg ha-1, while the total land area under wheat cultivation in Khyber Pakhtunkhwa is 769.5 thousand ha, which produced 1204.5 thousand tones with average production of 1556 kg ha-1. The area and production of wheat increased by 5.8% and 14.7% respectively as compared to 2008-2009 (MINFA, 2010). Our wheat yield is very low as compare to the yield of other wheat producing countries of the world. Low production of wheat is due to certain factor like genetic, agronomic and environmental factors. Quality, production and improvement in grain yield can be gained by use of balanced nutrient application especially NPK to improved varieties of wheat crop Ahmad and Rashid, 2004.
Fertilizer application at proper time through proper method in balanced proportion shows better impact on crop productivity (Nasir et al. [1]; Alam et al. [2]). In plants, phosphorus plays an important function in many physiological processes, viz. photosynthesis, storage of energy and its transfer, respiration and cell enlargement and cell division etc. Essential energy rich phosphate compounds which derive various biochemical reactions within the plant include adenosine triphosphate (ATP) and adenosine diphosphate (ADP). The function of phosphorus in plants is not limited to the metabolic reactions. The structure of biochemical components of living things, viz. nucleic acid (DNA, RNA), nucleotides, phospholipids and phosphoproteins is not possible without phosphorus. Phosphorus deficiency is a yield reducing factor. In wheat phosphorus deficiency reduces number tillers and plant leaf area by producing smaller and less number of leaves Sato et al. [3].
Pakistani soil is alkaline and mostly calcareous; therefore most of the native and applied phosphorus becomes unavailable during crop growth Sharif, 1985. Application of phosphorus fertilizer through appropriate method at optimum quantity and time is the main factor to increase crop production and its sustainability. Experiments proved that the number of roots to fertilizers contact is a key factor, the moor roots which come in contact with soil enrich in phosphorus, better is the availability of phosphorus to the plant Barber [4]; Yao and Barber [5]. Keeping in view the role and importance of phosphorus in crop productivity, this research study was planned to investigate the effect of different phosphorus levels on wheat crop.
Materials and Methods
An experiment was conducted at Cereals Crops Research Institute, Pirsabak, Nowshera on 'Impact of various levels of phosphorus on wheat (cv. PIRSABAK-2013)' during winter (rabi) 2014-15. The experiment was carried out in simple randomized complete block (RCB) design, having three replications. Sub plot size was 5m x 1.8m. Row to row distance was kept as 30 cm. Wheat cv. PIRSABAK-2013 was sown at the seed rate of 120 kg ha-1. Single super phosphate was applied as source of phosphorus and urea for nitrogen. Agronomical treatments were kept the same for all the plots. The treatments comprised of the following five phosphorus levels with a constant dose of 120 kg N ha-1.
a) P1 = Control
b) P2 = 45 kg P ha-1
c) P3 = 60 kg P ha-1
d) P4 = 75 kg P ha-1
e) P5 = 90 kg P ha-1
Data Was Recorded on the Following Parameters During the Experimental Study
A. Leaf area tiller'1 (cm2): At anthesis stage three tillers were randomly selected from each sub plot. All the leaves were detached, counted and averaged to record leaf number tiller-1. After this leaf area of all leaves was measured and leaf area tiller-1 was calculated according to formula:

B. Days to Heading: Days to heading data was collected from the date of sowing till when 80% heads emerged in each sub plot and then averaged.
C. Days to Physiological Maturity: Days to physiological maturity were recorded by counting the days from the date of sowing to the date when 70 to 80% plants became physiological mature in each sub plot.
D. Plant Height (cm): Plant height data was recorded at maturity by measuring the height with the help of measuring rod from the base of the plant to the tip of spike of five representative plants in each sub plot randomly selected and was then averaged.
E. Spikes m-2: Spikes m-2 were recorded by counting the number of spikes in one of the central rows of each sub plot and was converted into number of spikes m-2 according to formula:

F. Spike length (cm): In case of spike length, spikes of five tillers were randomly selected from each sub plot and were measured with scale in cm from the basal joint of the spike till the terminal spike excluding the awns.
G. Number of grains spike-1: Five spikes were selected randomly from each sub plot and were threshed manually. The total number of grains were counted and averaged to record number of grains spike-1.
H. Thousand grains weight (g): Thousand grains were counted from threshed clean grains of each treatment and then were weighed with the help of high sensitive electronic balance to record thousand grains weight.
I. Biological Yield (kg ha-1): For recording biological yield data, four central rows of each sub plot were harvested at their maturity and the whole material was sun dried. After drying it was weighed by spring balance and was converted to (kg ha-1) by using formula:

J. Grain yield (kg ha-1): For recording grain yield data, four central rows were harvested from each sub plot with the help of sickle and were sun dried. After threshing the grains were weighed with the help of high sensitive electronic balance and converted into kg ha-1 by the following formula:

K. Statistical Analysis: Data generated were statistically analyzed using analysis of variance techniques appropriate to RCB Design and upon obtaining significant differences, least significant difference (LSD) test was used for comparison among the treatment means.
Experimental Results
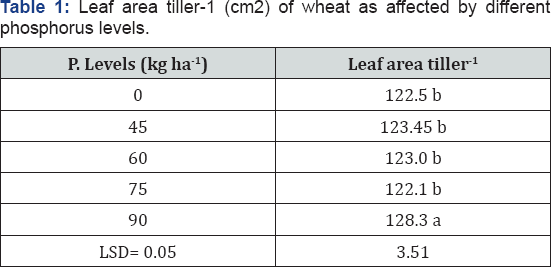
Leaf area Tiller-1 (cm2): Data regarding leaf area tiller-1 is shown in the (Table 1). Data after statistical analysis resulted that there is a significant (p≤0.05) effect of different levels of phosphorus on number of leaves tiller'1. Maximum leaf area tiller'1 (128.3 cm2) were recorded from the plots that were treated with 90 kg P2O5 ha-1. While minimum leaf area tiller-1 (122.5 cm2) was recorded from the control plots which is statistically similar with 45, 60 and 75 kg P2O5 ha-1.
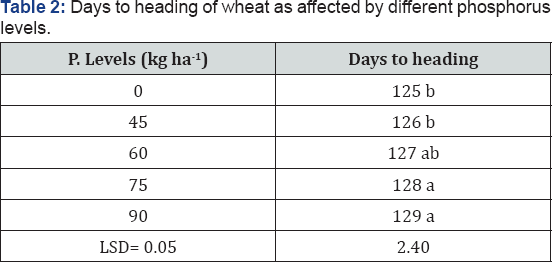
Days to Heading: Data regarding days to heading is shown in the (Table 2). Data after statistical analysis showed the significant (p≤0.05) effect of phosphorus on days to heading. Mean values revealed that plots treated with 90 kg P2O5 ha-1 crop took maximum days to heading (129) which is statistically similar to the 70 kg P2O5 ha-1.While crop took lowest number of days to heading (125) in the control plots which is statistically same to 45 kg P2O5 ha-1.
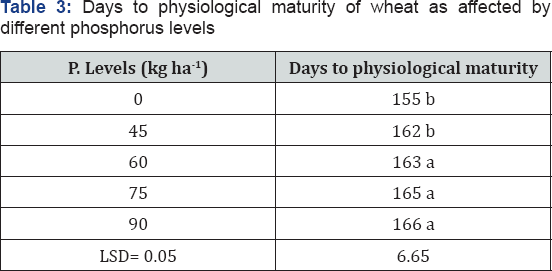
Days to Physiological Maturity: Table 3 shows data on days to physiological maturity as affected by different levels of phosphorus. Data after statistical analysis revealed that in wheat crop days to physiological maturity were significantly (p≤0.05) affected by different phosphorus levels. Mean values showed that crop took maximum days to physiological maturity (166) in the plots treated with 90 kg P2O5 ha-1 which is statistically same to the 45, 60 and 75 kg P2O5 ha-1 . While crop took minimum days to physiological maturity in control plots.
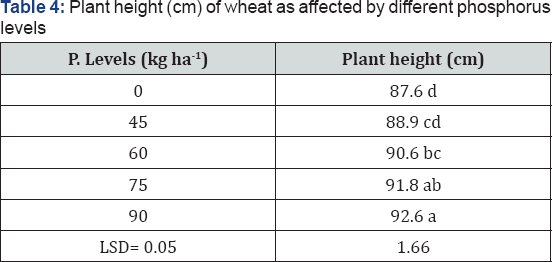
Plant Height (cm): Table 4 represents data on plant height of wheat crop as affected by different levels of phosphorus. Data after statistical analysis indicate significant (p≤0.05) effect on plant height. Highest plant height (92.6 cm) was recorded from the plots that were applied with 90 kg P2O5 ha-1 result is at par with 75 kg P2O5 ha-1 . Lowest plant height (87.6 cm) was observed in the control plots.
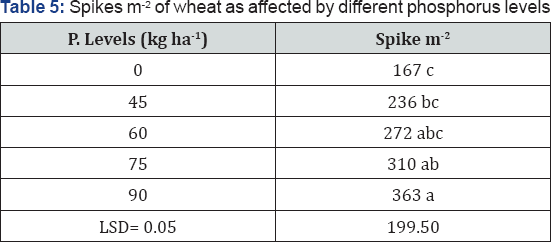
Spikes Meter-2: Table 5 showed data pertaining to the number of spikes meter-2 of wheat as affected by different levels of phosphorus. Data after statistical analysis revealed that in wheat crop number of spikes meter-2 were significantly (p≤0.05) affected by phosphorus levels. Mean values of data showed that plots treated with 90 kg P2O5 ha-1 produced maximum number of spikes meter-2 (363) result is statistically at par with 75 kg P2O5 ha-1 . While minimum number of spikes meter-2 (167) was recorded from the control plots.
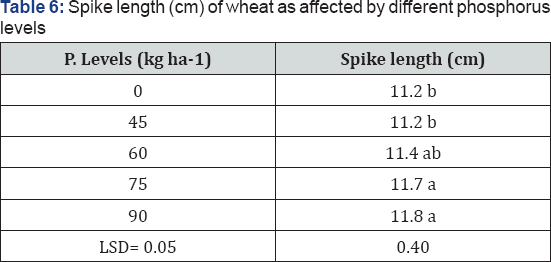
Spike length (cm): Data regarding spike length of wheat is shown in (Table 6). Data after statistical analysis shows that different phosphorus levels had significant (p≤0.05) effect on spike length. Mean values revealed that plots treated with 90 kg P2O5 ha-1 shows maximum spike length (11.8 cm) which is statistically similar to 70 kg P2O5 ha-1 . While minimum spike length (11.2 cm) were recorded from the control plots which is statistically similar to 45 kg P2O5 ha-1
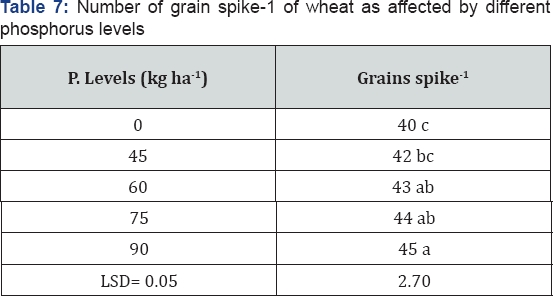
Grains spike-1: Table 7 represents data concerning number of grains spike-1 of wheat as effected by different levels of phosphorus. Data after statistical analysis showed significant (p≤0.05) effect of different levels of phosphorus on number of grains spike-1. Mean values for different phosphorus levels revealed that maximum number of grains spike-1 (45) were produced by the plots that received 90 kg P2O5 ha-1 result is statistically at par with 75 and 60 kg P2O5 ha-1 . While less number of grains spike-1 (40) were produced by the control plots.
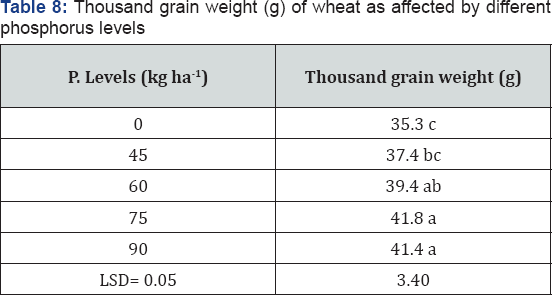
Thousand grain weight (g): Data concerning thousand grain weight of wheat is shown in (Table 8). Data after statistical analysis indicated the significant (p≤0.05) effects of phosphorus levels on weight of thousand grains of wheat. Mean values for different phosphorus levels showed that maximum weight of thousand grains (41.8g) was recorded from plots applied with 75 kg P2O5 ha-1 result is statistically similar with 90 kg P2O5 ha-1 . While minimum thousand grain weight (35.3g) was recorded from the control plot.
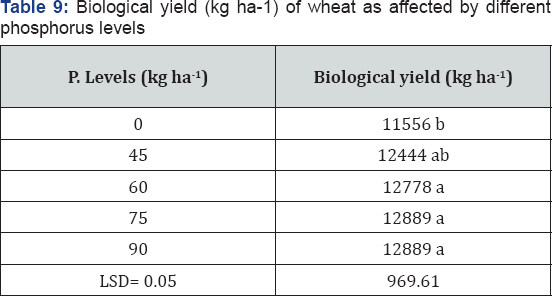
Biological yield (kg ha-1): Table 9 shows data recorded on biological yield of wheat as affected by different phosphorus levels. Data revealed after statistical analysis that there is a significant (p≤0.05) effect of phosphorus levels on biological yield of wheat. Plots that were treated with 90 kg P2O5 ha-1 give maximum biological yield (13056 kg ha-1) which is statistically similar with 60 and 75 kg P2O5 ha-1 . While in control plots minimum biological yield (11556 kg ha-1) was recorded.
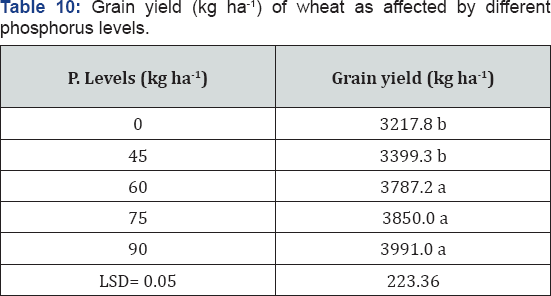
Grain yield (kg ha-1): Data regarding grain yield is shown in (Table 10) as affected by different phosphorus levels. Data after statistical analysis showed significant (p≤0.05) effect of different phosphorus levels on grain yield. Mean values for different phosphorus levels revealed that, plots that received 90 kg P2O5 ha-1 produced higher grain yield (3991 kg ha-1) which is statistically similar to 60 and 75 kg P2O5 ha-1. While minimum grain yield (3217.8 kg ha-1) recorded from controlled plots.
Discussion
Number of leaves tiller-1 was significantly (p≤0.05) affected by different levels of phosphorus. Maximum leaf area tiller-1 (128.3 cm2) was recorded from the plots that were treated with 90 kg P2O5 ha-1 . While minimum leaf area tiller-1 (122.5 cm2) was recorded from the control plots which is statistically similar with 45, 60 and 75 kg P2O5 ha-1 . Reason for maximum leaf area tiller-1 from the plots that were treated with 90 kg P2O5 ha-1 is that phosphorus enhance many physiological processes and also enhance respiration, cell enlargement and cell division. Similar results are obtained by Sato et al. [3] who found that in wheat phosphorus deficiency reduces plant leaf area by producing smaller and less number of leaves.
Days to heading was significantly (p≤0.05) affected by different levels of phosphorus. Maximum days to heading (128.7) was recorded from the plots treated with 75 kg P2O5 ha-1 which is statistically similar to the 90 kg P2O5 ha-1 .While crop took lowest number of days to heading (125.3) in the control plots which is statistically similar to 45 kg P2O5 ha-1 . Similar results are reported by Hussain et al. [6] who found that increasing rate of phosphorus enhance earlier production in wheat and ultimately early maturity of crop.
Days to physiological maturity were significantly (p≤0.05) affected by different phosphorus levels. Maximum days to physiological maturity (166) in the plots treated with 90 kg P2O5 ha-1 which is statistically same to the 45, 60 and 75 kg P2O5 ha-1 . While crop took minimum days to physiological maturity in control plots. Increasing phosphorus level enhanced the earlier anthes is and maturity of wheat crop Hussain et al. [6] Plant height was significantly (p≤0.05) affected by different levels of phosphorus. Highest plant height (92.6 cm) was recorded from the plots that were applied with 90 kg P2O5 ha-1 result is at par with 75 kg P2O5 ha-1 . Lowest plant height (87.6 cm) was observed in the control plots. Different phosphorus levels showed that with increasing rate of phosphorus increased plant height. Similar results are found by Rahim, 2010. That phosphorus application had significantly increased plant height of wheat. Similarly Hussain et al. [6] reported that wheat crop with 120 kg P2O5 ha-1 give plant with maximum height.
Some other scientists Khan et al. [7] Maqbool et al. [8] also reported significant effect of phosphorus sources on plant height. Number of spikes meter-2 were significantly (p≤0.05) affected by different phosphorus levels. Plots treated with 90 kg P2O5 ha-1 produced maximum number of spikes meter-2 (363) result is statistically at par with 75 kg P2O5 ha-1 . While minimum number of spikes meter-2 (167) were recorded from the control plots. Number of spikes meter-2 in wheat increased significantly with increasing rate of phosphorus Ali et al. [9] Jiang et al. [10]. The more the number of tillers, the better will be the stand of crop, which ultimately increases the yield Jamwal and Bhagat et al. [11]
Various phosphorus levels had significantly (p≤0.05) effected spike length. Plots that were treated with 75 kg P2O5 ha-1 shows maximum spike length (11.7 cm) which is statistically similar to 90 kg P2O5 ha-1 . While minimum spike length (11.2 cm) were recorded from the control plots which is statistically similar to 45 kg P2O5 ha-1 . Significant results were observed for spike length by application of different phosphorus levels Ahmad & Rashid (2003). Results of our study are inline with Lombi et al. [12] McBeath et al. [13] who observed that basal application of the recommended dose of DAP produced significantly taller spike length that ultimately increased the grain and straw yields.
Number of Grains spike-1 had significantly (p≤0.05) effected by different levels of phosphorus. Different phosphorus levels revealed that maximum grains spike-1 (45) were produced by the plots that received 90 kg P2O5 ha-1 result is statistically at par with 75 and 60 kg P2O5 ha-1 . While less number of grains spike-1 (40) were produced by the control plots. Ravnskov et al. [14] Reuter et al. [15] and reported that the application of phosphatic fertilizer significantly enhanced the number of grains per spike.
Significant (p≤0.05) effects had observed by different phosphorus levels on weight of thousand grains of wheat. Different phosphorus levels showed that maximum weight of thousand grains (41.8g) was recorded from plots applied with 75 kg P2O5 ha-1 result is statistically similar with 90 kg P2O5 ha-1 . While minimum thousand grain weight (35.3g) was recorded from the control plot. Bhatti et al. (1986) and Rahmatullah et al. (1994) reported that 90 kg P2O5 ha-1 as optimum level for wheat crop. Similarly Nawaz (1989) and Brennan (1992) observed a progressive increase in 1000 grains weight with gradual increase in phosphorus dose from 60 to 120 kg P2O5 ha-1 .
Biological yield of wheat has significantly (p≤0.05) effected by different phosphorus levels. Plots that were treated with 90 kg P2O5 ha-1 give maximum biological yield (13056 kg ha-1) which is statistically similar with 60 and 75 kg P2O5 ha-1 . While in control plots minimum biological yield (11556 kg ha-1) was recorded. Similarly highest grain and straw yields were observed where P was applied Alam, 2002 same results are inline with Straw yield was higher; where phosphorus fertilizer was applied as compared to that where no P fertilizer was applied in case of wheat crop (Yaseen 1998). Significant (p≤0.05) effect has shown by different phosphorus levels on grain yield. Various phosphorus levels revealed that, plots that received 90 kg P2O5 ha-1 produced higher grain yield (3991 kg ha-1) which is statistically similar to 60 and 75 kg P2O5 ha-1 . While minimum grain yield (3217.8 kg ha-1) recorded from controlled plots. The main reason for increase in grain yield with different levels of phosphatic fertilizer might be the higher 1000-grain weight which might be due to higher rate of photosynthesis and better crop health which ultimately increased the final grain yield. Plants showed normal growth with the application of phosphorus and resulted in improved agronomic traits which lead toward improved grain yield. Similar findings were explained in previous research by Ihsan, Iqbal and Mehdi 2003 [15-21].
For more articles in Open Access Journal of Environmental Sciences & Natural Resources please click on: https://juniperpublishers.com/ijesnr/index.php


Comments
Post a Comment