Propagation of Santa Maria on Wild Pear Rootstock through Different Budding Techniques - Juniper Publishers
Juniper Publishers- Open Access Journal of Environmental Sciences & Natural Resources
Propagation of Santa Maria on Wild Pear Rootstock through Different Budding Techniques
Authored by Waqas Khan
Abstract
Different budding techniques were practiced to propagate Santa Maria pear on wild pear [Pyrus pashia] rootstock under the agro-climatic conditions of Mansehra, at Agricultural Research Station Baffa Mansehra during 2015. Four different budding techniques i.e. T-budding, Patch budding, Chip budding and Ring budding were practiced to investigate their effects on different growth parameters after 60 days i.e., Days to sprouting, Bud take success, Budding growth, Stem thickness, No. of leaves and No. of branches. Minimum days to sprouting [26.3] and maximum bud take success [69.3%], budding growth [14.4 cm], stem thickness [0.4 cm], No of leaves [10.3] and No of branches [2.2] were observed in plants budded by T-budding, while maximum days to sprouting [30.9] and minimum bud take success [40.3%], budding growth [9.2 cm], stem thickness (0.1 cm), No. of leaves (5.4) and No. of branches (1.3) were observed in plants budded by Chip budding. T-budding showed significant results among all of the parameters studied. It can be concluded that T-budding is a better option for better bud take success, days to sprouting, budding growth, stem thickness, No. of leaves and No. of branches.
Keywords: Budding; Wild pear Rootstock; Santa Maria; Bud Take Success
Materials and Methods Experimental Location
The experiment, propagation of Santa Maria on wild pear rootstock through different budding techniques was conducted at Agricultural Research Station Baffa, Mansehra, KP, Pakistan during 2015. The station is situated at 34.44 north latitude, 73.22 east longitudes and on 960 meters elevation above the sea level. The climate here is mild, and generally warm and temperate. The rainfall in Baffa is significant, with precipitation even during the driest month. According to Koppen and Geiger, the Mansehra climate is classified as CFA (C=warm temperature, F=fully humid, A=hot summer). The average annual temperature in Baffa is 19.3 °C. The rainfall here averages 1494 mm [1].
i. Plant Material: The plant material for rootstock was taken from Pyrus phasia locally known as Batangi and the Santa Maria was used as a scion variety. The rootstock and scion material was provided by Agricultural Research Station Baffa Mansehra.
ii. Soil Preparation: The soil was ploughed and five trolleys [about 10000kg] of well rotten Farm Yard Manure [FYM] were applied per hectare. The seeds of wild pear were planted after treating it with fungicide i.e. [success]. The plant to plant and row to row distance was kept at 7-15 cm and 70-90 cm, respectively. Cultural practices such as irrigation, weeding and removal of fall sprouts below bud union were followed with regular intervals.
iii. Experimental Design: The experiment was designed in a randomized complete blocks design [RCBD] with 3 replications and 4 treatments. There were 20 plants per replication and 15 plants in each treatment.
iv. Experimental Procedure: The Fifteen months old wild pear [Pyrus pashia] seedlings having pencil size diameter were used as rootstocks. The one year old bud wood [Santa Maria] was selected from the pear orchard of Agriculture Research Station Baffa, Mansehra, KP, Pakistan. The bud wood was selected from vigorous plants in the pear orchard. The length of bud wood was 2.5 cm and the length of cut made in rootstock for inserting bud was 2.5-3 cm. The budding height was 17 cm. On the other hand, T, Patch, Chip and Ring budding techniques were practiced. The buddings during in the growing season were done on June 25th, 2015. Polythene tapes were used for wrapping. When the bud reached 10-15 cm in length, then the stock above union was removed.
v. Analysis: Data on sprouting were recorded after bud sprouting, while bud take success was recorded 2 months/ 60 days after budding. Observations on budding growth, stem thickness, No. of leaves and No. of branches were recorded after 60 days. Data as percentage were transformed and statistical analyses were applied over these transformed data by using Statistix 8.1 software. The LSD Test was used to indicate the differences between the average data.
vi. Parameters Studied Bud take success (%): Data were recorded on bud take success and percent success was calculated with the help of following formula. Bud take success % = Total number of successful buds/ Total number of budded plants x 100
vii. Days to sprouting: Data were recorded on days taken to sprouting after budding and the mean was calculated.
viii. Budding growth (cm): Data were recorded on budding growth. The growth of the budding was measured by using a measuring tape. The mean was calculated.
ix. Stem thickness (cm): Data were recorded on stem thickness by using vernier caliper. The calibration of vernier caliper in mm was then converted into cm. The mean was calculated.
x. Number of leaves plant -1: Data were recorded on No. of leaves plant -1 and the mean was calculated.
xi. Number of branches plant -1: Data were recorded on No. of branches plant -1 and the mean was calculated.

a. Results: The overall data recorded on the below parameters are presented in [Table 1]. However, the results of individual parameter are discussed below.
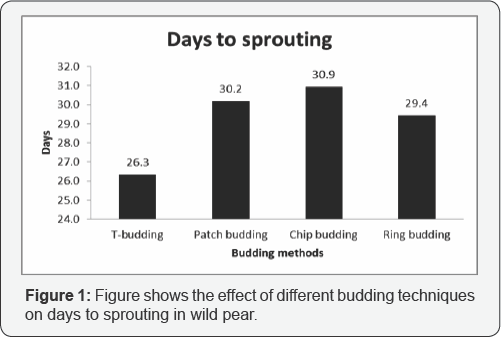
i. Days to sprouting: The statistical analysis of data showed a significant variation of different budding techniques for days to sprouting [Figure 1] and [Table 1]. Early sprouting [26.3 days] was observed in T-budding followed by ring budding [29.4 days], patch budding [30.2 days] and late sprouting was recorded in chip budding [30.9 days].
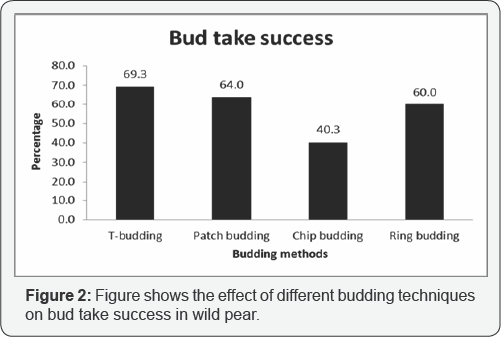
ii. Bud takes success (%age): The data pertaining percent bud take success showed that the different budding methods had a significant effect on percent bud take success [Figure 2] and [Table 1]. Maximum bud take success [69.3%] was recorded for the plants budded by T-budding, followed by the plants [64.0%] budded by patch budding and the plants [60.0%] budded by ring budding, while minimum bud take success [40.3%] was obtained for plants budded by chip budding.
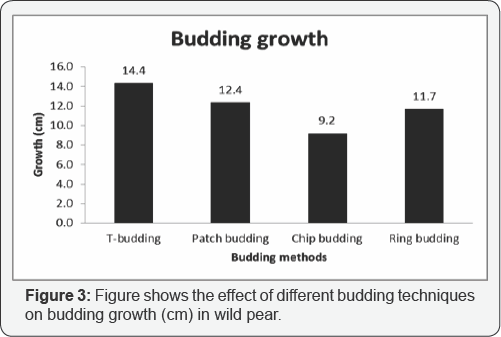
iii. Budding growth (cm): The data pertaining to budding growth after 60 days showed that budding methods had significant effect on budding growth (Figure 3) and (Table 1]. Mean values of budding growth revealed that maximum budding growth [14.4 cm] was recorded in plants propagated through T-budding, followed by plants [12.4 cm] budded by patch budding and plants (11.7 cm) budded by ring budding, while minimum budding growth (9.2 cm) was produced in plants budded by chip budding.
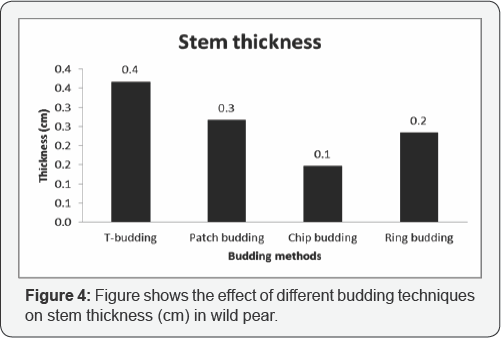
iv. Stem thickness (cm): The data pertaining to stem thickness after 60 days showed that different budding methods had significant effect on stem thickness. Comparing the means of different budding methods in (Figure 4) and (Table 1). it is concluded that maximum stem thickness (0.4 cm) was noted for plants budded by T-budding, followed by the plants (0.3 cm) budded by patch budding and the plants (0.2 cm) budded by ring budding, while the minimum stem thickness (0.1 cm) was obtained in plants budded by chip budding.
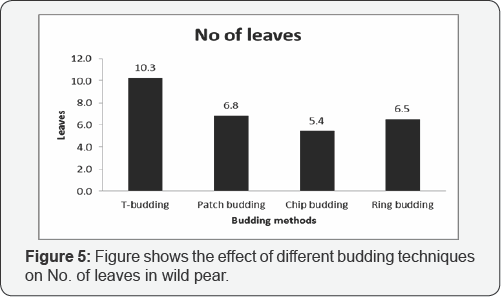
v. Number of leaves plant -1: The data recorded for the number of leaves plant -1 after 60 days showed that different budding methods had significant effect on number of leaves plant -1 (Figure 5) and (Table 1). Mean values of different budding methods showed that maximum number of leaves plant-1 (10.3) was noted for plants budded by T-budding, followed by the plants (6.8) budded by patch budding and the plants (6.5) budded by ring budding, while the minimum number of leaves plant -1 (5.4) was recorded in plants budded by chip budding.
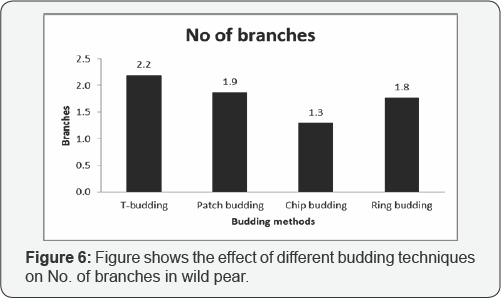
vi. Number of branches plant -1: The data obtained for the number of branches plant-1 after 60 days showed that different budding methods had significant effect on the number of branches plant-1 (Figure 6) and (Table 1). Comparing the means of different budding methods, it is concluded that maximum number of branches plant-1 (2.2) were noted for plants budded by T-budding, followed by the plants (1.9) budded by patch budding and the plants (1.8) budded by ring budding, while the minimum no of branches plant-1 (1.3) were recorded for plants budded by chip budding.
b. Discussion: Maximum number of days to sprouting (30.9) were taken by plants budded by Chip budding, while minimum number of days to sprouting (26.3) were recorded in plants budded by T-budding. T-budding is a conventional method of propagation. T-budding leads to increased strength of rootstock and scion together and a lesser surface of wound is exposed to climatic conditions and as a result, healing at the bud union happens much better and quicker in T- budding, so therefore the minimum number of days to sprouting were observed in T-budding [2,3]. Data regarding bud take success revealed that maximum bud sprouting (69.3%) was recorded for plants budded by T-budding and minimum bud sprouting (40.3%) was noted in plants budded by Chip budding. It is due to the fact that from June to August the plants have high cell sap and T-budding require high cell sap and T-budding have directly contact with the cambium layer, while Chip budding have a chip of wood and therefore are not in directly contact with the cambium layer [4,5].
The lower percent healing might be due to the climatic factor such as warm season or use of over mature bud wood or poor plant vigor [6]. It is revealed from result that maximum budding growth [14.4 cm] was noted when budding was done by T- budding, while the minimum budding growth [9.2 cm] was recorded when plants were budded by chip budding. It might be due to the stronger bud union and development of normal vascular tissues at the bud union which regulates the transport of water and nutrients and therefore enhance the active growth of scion [7]. Statistical analysis of the data revealed that different budding methods had significant effect on No. of leaves. Maximum number of leaves [10.3] was noted in plants budded by T-budding, while minimum number of leaves [5.4] were found in plants budded by Chip budding. This is due to the maximum budding growth in plants budded by T-budding which results in more number of leaves plant-1 as compare to plants budded by Chip budding which has resulted minimum budding growth.
Statistical analysis of the data revealed that different budding methods had significant effect on stem thickness. Maximum stem thickness [0.4 cm] was recorded on plants budded by T-budding, while minimum stem thickness [0.1 cm] was observed in plants budded by Chip budding. Maximum stem thickness might be due to the maximum budding growth in those plants budded by T-budding which contributed to the additional photosynthesis due to directly contact with the cambium layer and increase in growth and development of the stem [8]. Statistical analysis of the data revealed that different budding methods had significant effect on No. of branches. Maximum number of branches [2.2] were recorded in plants budded by T-budding and minimum number of branches [1.3] was noted in plants budded by Chip budding. It is evident that the number of branches has direct relation with number of leaves per plant. Plants having more branches will have more number of leaves and vice versa [9].
Conclusion
Among all of the budding techniques practiced on wild pear i. e. T, Chip, Patch, and Ring budding, the T- budding showed good results in all of the plant growth parameters i.e. Bud take success [%], Days to sprouting, Budding growth, Stem thickness, No. of leaves and No. of branches plant -1.
For more articles in Open Access Journal of Environmental Sciences & Natural Resources please click on: https://juniperpublishers.com/ijesnr/index.php


Comments
Post a Comment