Effects of Land Use/Cover Type On Surface Water Quality: In The Case Of Chancho and Sorga Watershed, East Wollega Zone, Oromia, Ethiopia - Juniper Publishers
Juniper Publishers-Open Access Journal of Environmental Sciences & Natural Resources
Effects of Land Use/Cover Type On Surface Water Quality: In The Case Of Chancho and Sorga Watershed, East Wollega Zone, Oromia, Ethiopia
Authored by Tolera Megersa
Abstract
Background: It has been widely accepted that there is a close relationship between the land use type and water quality. Land use/cover type can influence surface water quality either positively or negatively depending up on the cover type of the study area.
Methods and Materials: This study aims to analyze the influence of various land use types on the water quality within three sub watersheds based on water quality monitoring data for the selected water quality parameters and DEM and Google earth image of 2016 used for watershed delineation and land use/cover classification of the study sub-watersheds.
Result:The result indicated that there were significant differences among the land use/cover types in deteriorating water quality. Agriculture dominated surface water values for total nitrogen, total suspended solids & acidity (5.09 and 65.68mg/l, 4.67), respectively, was greater than the others two land uses, this is because of use of inorganic fertilizer and runoff from cultivated land, whereas, Urban dominated surface water was greater in total dissolved solid (111.7mg/l), it is due to urban dissolved solids runoff to the downstream. Forest dominated surface water has fewer amounts of TDS, TSS &TN (62.66, 18,28,2.95 mg/l), as compared to other land use types. Total phosphors(TP) values of Urban, Agriculture& Forest dominated surface water were 0.74,0.56 &0.0001mg/l, respectively, which was greater in Urban followed by Agriculture dominated surface water. Besides, correlation among water quality indicators were analyzed for each land use/cover type, the results of correlation analysis indicated that almost all water quality parameters of forest and agriculture dominated sub-watershed values were positively correlated with each other, except TSS and TN of forest and TN and PH of agriculture were negatively correlated. Whereas, more of urban dominated surface water quality parameters values were negatively correlated to each other, except TN and PH at 95% confidence interval.
Conclusion:Surface water quality depends on the available land use/cover type at the buffer zone of surface water. Forest dominated sub watershed had contributed less amount for all water quality parameters to the surface water as compared to others land use/cover types. Forest cover helps to control runoff by retaining of water and increasing water infiltration rate of the soil. Therefore, surface water quality can be improved only if an appropriate watershed management practice is in place.
Keywords: Land Use; Surface Water; Sub-Watershed; Water Quality
Introduction
Water quality deterioration in reservoirs usually comes from excessive nutrient inputs, eutrophication, acidification, heavy metal contamination, organic pollution and obnoxious fishing practices. The effects of these “imports” into the reservoir do not only affect the socio-economic functions of the reservoir negatively, but also bring loss of structural biodiversity of the reservoir [1,2] have used the physico-chemical properties of water to assess the water quality of a reservoir. The use of the physico-chemical properties of water to assess water quality gives a good impression of the status, productivity and sustainability of such water body. The changes in physical characteristics like temperature, transparency and chemical elements of water such as dissolved oxygen, chemical oxygen demand, nitrate and phosphate provide valuable information on the quality of the water, the source(s) of the variations and their impacts on the functions and biodiversity of the reservoir.
The quality of surface water has deteriorated in many countries in the past few decades. As a result of the growing population, increasing industry, agriculture, and urbanization, the inland water bodies are confronted with the increasing water demand, as facing with extensive anthropogenic inputs of nutrients and sediments, especially the lakes and reservoirs [3]. To handle this problem, it is necessary to carry out water quality assessment, planning, and management, in which water quality monitoring plays an important role [4].
The land use within the watershed has great impacts on the water quality of rivers. The water quality of rivers may degrade due to the changes in the land cover patterns within the watershed as human activities increase [5,6]. Changes in the land cover and land management practices have been regarded as the key influencing factors behind the alteration of the hydrological system, which lead to the change in runoff as well as the water quality. There have been three waves of the research that tried to reveal the effects of the land use and land cover change on the quality of surface water [7]. The researchers have started to study the linkage between land cover and the river water quality in order to investigate the effects of morphological features of watersheds on the turbidity, dissolved oxygen and temperature of the river water since the early 1960s [1]. The second wave of researches on this topic emerged in the 1970s, focusing on the analysis at the watershed scale [2]. The third wave of these studies have started to take advantage of the remote sensing, GIS, and multivariate analysis to explore the influence of the land cover on the suspended sediment, nutrients and ecological integrity of the stream [8,3]. In the highlands of Ethiopia, agricultural practices and human settlement have a long history and recently a high population pressure including unsustainable practices and depletion of the natural resources. As a result, significant land-cover changes have been observed since the last century [9]. These changes are caused primarily by anthropogenic activities, because increasing population has forced people to clear forest for cultivation and for forest products [10]. In Ethiopia, previous studies reported that there have been considerable LULC changes in different parts of the country over the different time periods [11], reported that there was a strong decrease of the forest and bush land in favor of arable land and rangeland from 1965 to 1994 in Eastern Tigray. For the period between 1957 and 1995, there was a significant increase in cultivated land at the expense of forests in the Dembecha area of North West Ethiopia
Comparative studies have found that land use has significant impacts on river water quality and that the mechanisms are complex [1,3]. Deforestation, agricultural activities and urbanization generally modify land surface characteristics [9], alter runoff volume [12,13], change water temperature [4], and generate pollution [14,15], increase algal production [3] and decrease concentrations of dissolved oxygen in water bodies [16]. Despite the many studies that have described the general relationships between land use and water quality, those relationships are not fully understood [8]. For example, there are still uncertainties regarding whether urban or agricultural land use is more important in influencing water quality on the scale of catchments. Donohue et al. [12] identified that urban, arable and pasture lands were the principal factors affecting water quality in Irish rivers. Lee et al. [14] found urbanization, rather than agricultural land use, was a major factor in water quality degradation in South Korea. Fisher et al. [17] found agricultural impacts should be given priorities in natural resource management to reduce agricultural non-point source pollution in the Upper Oconee watershed of Georgia, USA. Sliva and Williams [18] found that the influence of agriculture was variable, and agriculture was negatively associated with nutrients in spring and fall in Ontario watersheds, Canada. These mixed results are partly due to the distinctive characteristics of each watershed. The highly dynamic aquatic ecosystems also result in greater complexity in research and management. Therefore, the study aimed at assessing the effects of different land use/cover types on surface water quality by analyzing some selected physic-chemical water quality parameters as to indicate water quality differences a result of human induced land use and cover types under different three sub watersheds.
Materials and Methods
Description of Study Area
The selected sub watersheds are found in East Wollega Zone, Chancho in Diga District and Sorga in Nekemte town, Ethiopia .The study sites are characterizes as agriculture, forest and Urban dominated sub watershed .In which Chancho surface water is belongs to Agriculture dominated sub watershed and Sorga surface water is as of Forest dominated sub watershed and Lega Marga surface water is under urban dominated sub watershed. The sub watersheds are located in between 9o01’ North and 36o28.2’East. The Chancho surface water is belongs to Chancho sub-watershed at the bottom edge, which was constructed for the supply of dirking water to Nekemte town, and Sorga is used as a site for fish production and recreational areas and laga Merga surface water is used for crop irrigation. The total area of the study sub-watersheds chancho (1565hac), Sorga (2261 hac) and Laga marga (324 hac). The sources of water for the each are primarily rainy water and few streams flow to each surface water (Figure 1).

Population of the Study Areas
Sorga forest & Urban dominated sub watershed is one of the most densely populated in which urban and rural settlers are living as compared to Chancho Agriculture dominated sub watershed where only rural settlers are living. The total populations of rural settlers in Sorga and chancho watershed are 5160 and 2604, respectively, and urban settlers are 2664 in Sorga urban dominated sub-watershed. Agriculture is the main economic activity undertaking within a two watershed, but urban small scale enterprise is the prime source of income for Urban settlers in the case of Sorga Urban dominated sub watershed (Figure 2).

Land Use/Cover Types of Study Watershed
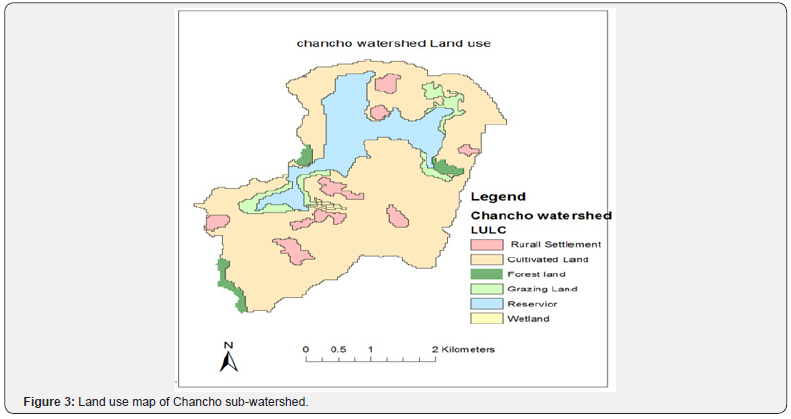
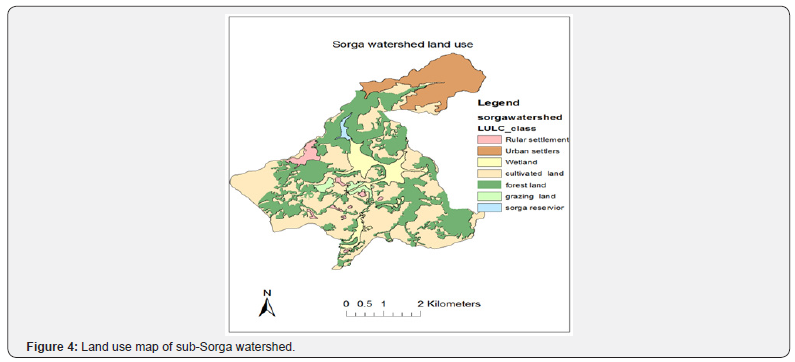
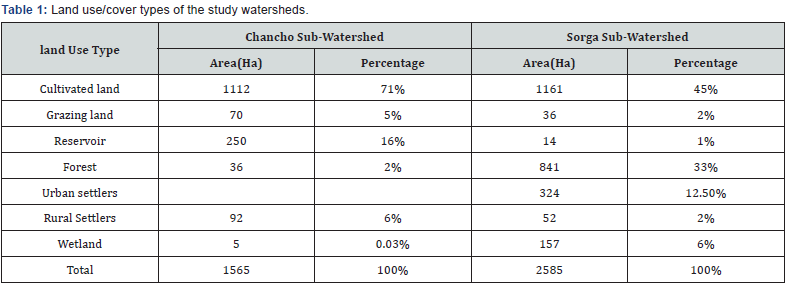
The current land-use distribution in the watersheds are the result of various anthropogenic and natural processes that have occurred during the last decades, including the diminishing and abandonment of forest land to farmland for economic purposes. As shown on (Figures 3 & 4) cultivated land is the dominant land use type under Chancho and Sorga watershed, which accounts 71% and 45% of the total watershed, respectively. Forest land is second in area coverage for Sorga sub-watershed, accounts 33% and only 2% forest area coverage in Chancho sub-watershed. Wetland area coverage of Chancho and Sorga watersheds were 0.03% and 6%, respectively. Chancho watershed is entirely occupied by rural settlers and sorga watershed is more of rural settlers, which accounts 87.5%, and less of urban settlers, accounts 12.5%.
Climatic Data of the study area
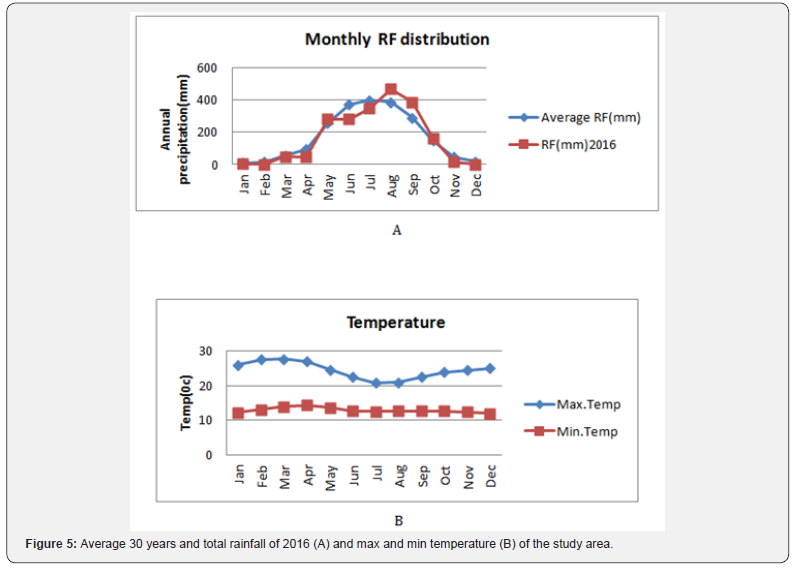
The study area is located in the western part of the country receives relatively high amount of rainfall during the rainy season from late April to Early October. The mean annual rainfall data according to national metrological agency of Ethiopia of the study area is 2004mm/year. The monthly mean maximum and mean minimum temperature is 230c and 120c respectively (Figure 5).
Methods and Methods
Catchment Delineation
The study watershed delineation and land use was done by using digital elevation model and Google earth image. The watershed was divided into sub watersheds that are characterized by dominant land use, soil type, vegetation covers and management. SWAT integrated with Arc GIS was used to delineate, classify and identify the watershed areas and land use.
Study Watershed and Location of Sampling Areas
The cluster analysis showed that 8 sampling sites can be divided into three groups of relatively considering their dominant land use types surrounding the surface water areas, the three site groups were designated as forest dominated sub-watershed, Cultivated land dominated sub-watershed and urban-dominated micro-watershed, which were characterized by predominately forested land, cultivated and urban land located at the buffer zone areas of each surface water with an average 0.5km radius, respectively. Water contamination in surface water is highly dependent on water runoff in the surrounding drainage areas. It is likely that land uses in drainage areas that are in close proximity to the surface water are more likely to have stronger influences on the chemical and biological conditions of water than those farther away. Thus, this finding was focused on the dominant land uses type located near to the surface water within a range of 0.5km radius adjacent to the sampling site (Figures 6 & 7).
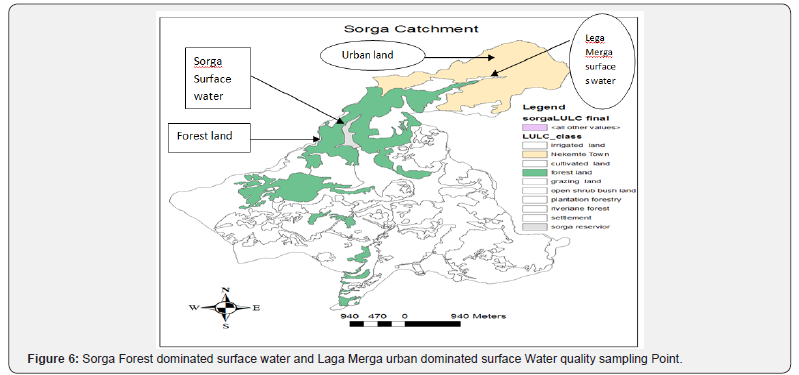
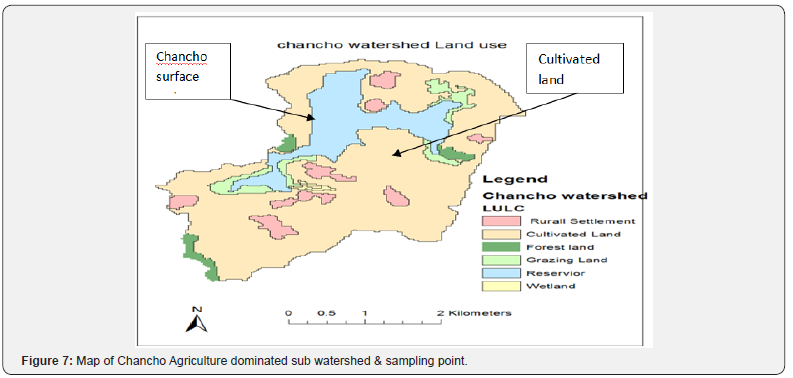
To capture the proportion of each type of dominant land use, water sample was taken from surface water adjacent to each sub watershed areas rather than the entire watershed area of the surface water, because small drainage areas can reveal the effects of land use on adjacent surface water more clearly. So, the study surface water areas were delineated using a GIS and digital elevation model (50 m resolution). Water sample was taken from three different sources (Figures 6 &7 ): Namely Chancho surface water is belongs to Chancho agriculture dominated sub catchment, Sorga surface water is belongs to Sorga forest dominated Sub-catchment and Lega Merga surface water is belongs to Sorga Urban dominated micro-watershed, in which Urban dominated found in Sorga sub-watershed.
Water Sampling
Water quality deterioration due to different land use/cover types within a watershed was investigated by taking water sample from three sources of surface water. Grab samples were collected in 0.5liter bottle from four sampling sites of Chancho Agriculture dominated surface water, two sampling sites of Sorga Forest dominated surface water and two sampling sites of Urban dominated surface water in which 16 samples twice per month during a peak rainy season (July, 2016-Sep, 2016) and 8 samples for the rest of months and a total of 120 samples were taken in a year. Sub watershed category was based on land use/ cover type located at the buffer zone of Surface water within 0.5 km radius.
Physico-Chemical Analysis
Samples were taken from respective reservoirs and streams from March, 2016 to Feb, 2017 during both dry and rainy seasons for selected water quality parameters includes; PH, Total Nitrogen (TN), Total Phosphorus (TP), Total dissolved solids (TDS) and Total suspended solids (TSS) and were analyzed in the laboratory every month. The analysis for each water quality parameter was undertaken according to the standard of physico-chemical analysis procedures. Mean values of each water quality parameters of the three sub watersheds were subjected to correlation analysis in order to understand the relation between each parameter. Samples were taken to Addis Ababa Environmental protection laboratory within 24 hrs and analyzed for each water quality parameters. The result for Total solid was calculated from the summation of TSS and TDS, that is Total Solid (TD)=Total suspended solid (TSS) + Total Dissolved solid (TDS).
Laboratory Analysis
The pH of the water samples was measured by using a pH meter (model HI 98130 HANNA, Mauritius, Iramac Sdn. Bhd.). The pH meter was calibrated, with three standard solutions (pH 4.0, 7.0, and 10.0), before taking the measurements. The value of each sample was taken after submerging the pH probe in the water sample and holding for a couple of minutes to achieve a stabilized reading. After the measurement of each sample, the probe was rinsed with deionizer water to avoid cross contamination among different samples.
The measurements of TSS, TDS, TN and TP in water samples were carried out according to the standard methods of APHA [5] and Sawyer et al. [3] by the filtration process. Therefore, the accuracy and precision of following methods are well approved and cited in the scientific literature. A fixed volume of water sample was poured on a pre weighed glass fiber filter of a specified pore size before starting the vacuum filtration process. The filter was removed after the completion of the filtration process and placed in an aluminum dish in an oven at 100°C for 2-3 hours to completely dry off the remaining water. The filter was then weighed, and the gain in filter weight represented the TSS contents, expressed in mass per volume of sample filtered (mg/L). The TDS of the water samples were determined by the gravimetric method. After filtration for TSS analysis, the filtrate was heated in oven at above 100°C until all the water was completely evaporated. The remaining mass of the residue represents the amount of TDS in a sample.
Statistical Analysis
Relationships among the considered variables were tested using Pearson’s correlation with statistical significance set priori atpb0.05. Analysis of variance (ANOVA) was used to compare variations in water quality under different land uses with significance set at pb0.05 (least-significance difference, LSD). All the statistical analyses were performed using R soft ware for window. Microsoft Excel was used to gather all of our results in the form of table and graph. Program R was used to develop line graphs, bar graphs, and box for a clear view of our concluding results.
Results and Discussions
Effects of Land Use and Cover Types on Water Quality
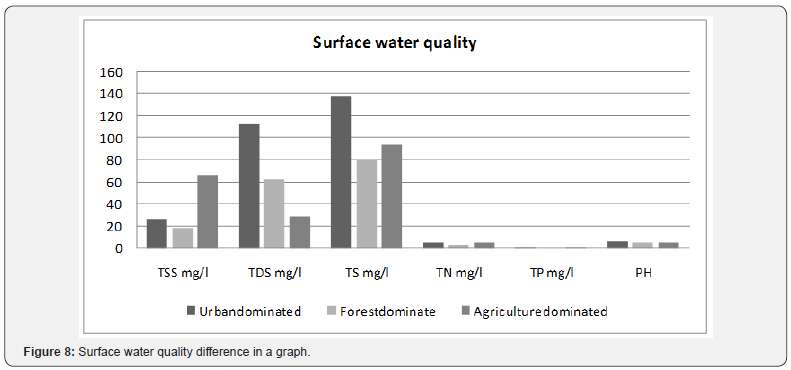
Water samples were taken from surface water located at the bottom of three different land uses/ cover type, namely; agriculture, forest and Urban dominated sub-watershed and analyzed in the laboratory. The result revealed that PH level of the agriculture dominated reservoir is relatively more acidic (4.87) than others (Table 1). The mean value of TN is higher in the case of agriculture dominated surface water than others study areas. This higher in PH and TN is because of the addition of nitrogen fertilizer to the cultivated land. The average value of TSS is also more in Agriculture dominated surface water than the others, this is due to more sediment by runoff from the cultivated fields. The mean value of TDS is much higher in the case of Urban dominated surface water, it because of dissolved solid substance drained to surface water from urban influent and sold waste. The mean value of TP is relatively high in the case of Urban and Agriculture dominated land use as compared to forest land, this is due to the addition of phosphors fertilizer to farm land and influent and waste drainage from urban land use.
Discussion
pH
PH is classed as one of the most important water quality parameters. Measurement of pH relates to the acidity or alkalinity of the water. A sample is categorized as acidic if the pH is below 7.0, whereas, alkaline if the pH is higher than 7.0. The standard limits of surface water pH range according to WHO and Ethiopia guidelines is between 6.5 and 8.5. The pH values of all samples were found in the range between 4.00 and 5.6 (Table 2), where the highest values were from Forest and urban dominated watershed as compared to agriculture dominated watershed, which is more acidic than the two sub watershed This indicates that, agricultural land contribute more acid forming ions to the water environment due to the use of nitrogen fertilizers.
Total Suspended Solids (TSS)
The maximum TSS limit of surface water set by WHO is 25 mg/L. The TSS values of all the surface water samples studied except for forest land were higher than the standard (Table 2). The highest value of 65.68 mg/L was found in water samples from the agriculture dominated watershed. It was also found that the samples collected from two other areas, forest and urban dominated land showed less TSS contents as compared to agricultural land. This is because of higher runoff condition of farm land.

Total Dissolved Solids (TDS)
TDS are the inorganic matters and small amounts of organic matter, which are present as solution in water. The standard or allowable value of the TDS set by WHO and Ethiopia is 1000 mg/L. The TDS values of all surface water samples were by far less than maximum limit of 1000 mg/L. The highest TDS mean values is 111.7mg/L and the lowest TDS values is 28.12mg/L correspond to samples from urban dominated micro watershed and Agricultural sub-watershed, respectively, (Table 2),whereas, the highest TDS mean values recorded for forest 62.66mg/l. This indicates that, more dissolved solids and influents are generated from the urban areas.
Total Nitrogen (TN)
The maximum limit TN limit of surface water set by WHO and Ethiopian is 10mg/l. The highest and lowest values of TN recorded were 17mg/l and 0.0001mg/l for agriculture dominated surface water and 15.5mg/l and 0.0001 mg/l for forest dominated one. Whereas, 10mg/l and 0.0001 mg/l of TN was corresponding to sample taken from urban dominated surface water. More amount of TN level was recorded in the case of agriculture dominated; this is due to the use of nitrogen containing inorganic fertilizer (UREA) for soil fertility amendment. Thus, some part of the added fertilizer is taken by the plant and others get into the water stream through runoff.
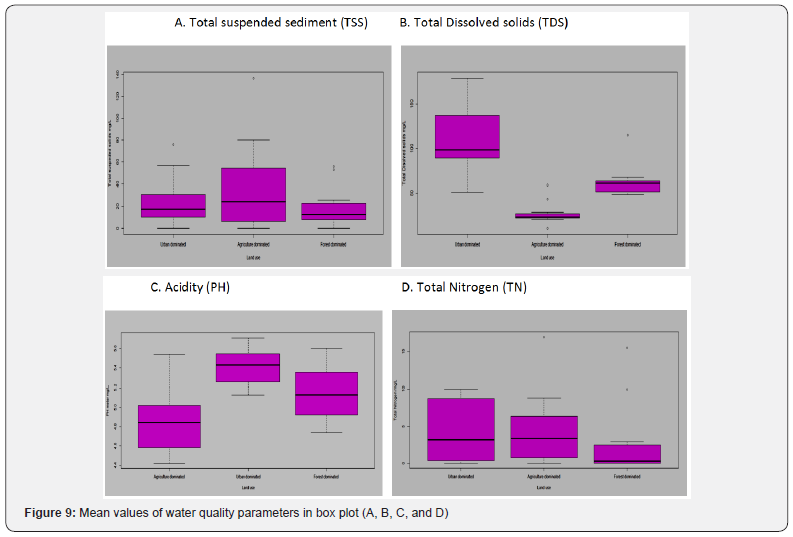
After all the values were gathered and analyzed, each variable was separated based on land use/cover type and tested to find any statistical difference using T-Tests. While the average mean values may have been different for each variable in both land areas, after testing the values, it appeared that there was no statistical difference for TSS,TN,TP &PH of the variables tested and only TDS mean value was statistical different(p=0.024) between three different land use/cover types at 95% confidence interval. Box plot (Figure 8) showed the visual comparisms of the difference among the three land use/cover types and data distribution and its variation from the medium values (Figure 9).
Antifungal resistance
Correlation Between Water Quality Indictors
A correlation analysis was conducted to examine the relationships between water quality variables of the three study sites. The results indicated that the water quality values of each dominant land use types were differently correlated with each other. Relationships among the considered variables were tested using Pearson’s correlation with statistical significance set priori at p< 0.05.
Total Suspended Solid (TSS)
Correlation analysis of surface water values of urban dominated sub watershed showed that, TSS had a significant negative correlation with TDS(r=-0.346),TN(r=-0.094),and PH(r=-0.265) and agriculture dominated sub watershed TSS was positive correlation with TDS(r=0.461) and TN(r=0.132),while negatively to PH(r=-0.005).Forest dominated sub watershed TSS also positively correlated with TDS(r=0.011)and PH(r=0.064) and negatively to TN(r=0.228).
Total Dissolved Solid (TDS)
TDS value of surface water of urban dominated sub watershed showed a positive correlation with TN(r=0.038) and negative correlation with PH(r=-0.479) and TDS value of agriculture dominated was showed positive correlation with TN(r=0.605) and PH(r=0.209).Whereas, TDS value of forest dominated showed a significant positive correlation with both TN(r=0.821) and PH(r=0.752).
Total Nitrogen (TN)
TN value of surface water of urban dominated sub watershed showed a positive correlation with PH(r=0.094) and TN value of agriculture dominated was showed negative correlation with(r=-0.142) TN value of forest dominated showed a significant positive correlation with PH(r=0.435).
The results of correlation analysis indicated that almost all water quality parameters of forest and agriculture dominated values of surface water quality were positively correlated to each other, except TSS with TN of forest and TN with PH of agriculture, were negatively correlated. Whereas, more of urban dominated sub watershed surface water quality parameters values were negatively correlated to each other, except TN with PH, which were negatively correlated.
Conclusion
In this study, the relationship between land use/cover type and the corresponding water quality within 0.5km land area to explore the effect of land use/cover types on the water quality of reservoirs. The 0.5km land scope was covered by cultivated, Forest and Urban for Chancho, Sorga and Nekemte town, respectively. The study aimed to study the effect of different land use/cover types on water quality. This study indicated that different land use/cover types affect water quality with a significant difference between each land use type. The effects of land use/cover types on water quality was more in Urban and Agriculture dominated sub watershed in all water quality parameters as compared to Forest dominated sub watershed. This indicates that forest land has a capacity of reducing surface runoff by increasing infiltration rate of the land; whereas, urban runoff due to impervious land surface is the main source of dissolved solids and Agriculture runoff is the source of suspended sediment and total nitrogen to the surface water. All water quality variables were correlated to each other differently. Most of the variables in the case of urban dominated sub watershed were negatively correlated to each other, whereas, most values of water quality variables of agriculture and forest dominated sub watersheds were positively correlated to each other. Therefore, it is recommended to plant trees around the buffer zone of surface water at the radius greater than 0.5km to sustain water bodies in terms of its quality and quantities.
To know more about Juniper Publishers please click on: https://juniperpublishers.com/manuscript-guidelines.php
For more articles in Open Access Journal of Environmental Sciences & Natural Resources please click on: https://juniperpublishers.com/ijesnr/index.php




Comments
Post a Comment