GIS Based Soil Erosion Estimation Using Rusle Model: A Case Study of Upper Kangsabati Watershed, West Bengal, India - Juniper Publishers
Juniper Publishers-Open Access Journal of Environmental Sciences & Natural Resources
GIS Based Soil Erosion Estimation Using Rusle Model: A Case Study of Upper Kangsabati Watershed, West Bengal, India
Authored by Asish Saha
Abstract
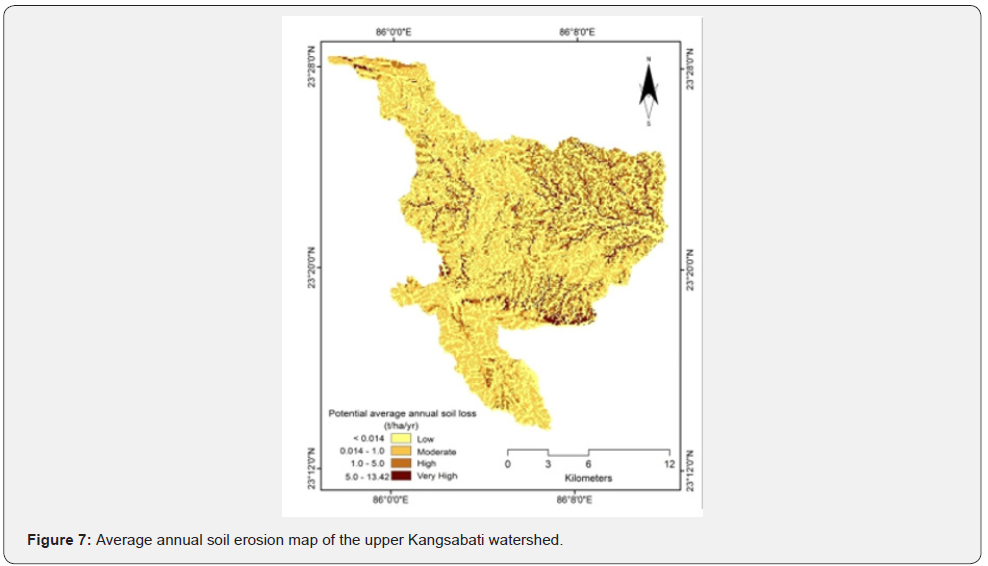
An accelerated rate of soil erosion is a serious and continuous endemic environmental problem in the western part of West Bengal. The present study is carried out in the upper Kangsabati watershed of Puruliya district, West Bengal with an area of 276.19 km2. It is fact that the surface runoff of seasonal rainfall is more in this area due to its sloping terrain characteristics. Average annual soil erosion has been estimated based on the five parameters defined in the Revised Universal Soil Loss Equation (RUSLE) and with the help of Geographical Information technology. Overlay of five parameters, viz., rainfall–runoff erosivity factor (R), soil erodibility factor (K), slope length and steepness factor (LS), cover and management factor (C) and support and conservations practices factor (P) has been done in GIS platform. Potential average annual soil erosion of the watershed has been classified into four categories. The High rate of soil erosion (>13.42 t ha-1 year -1) was found along the northeastern part of the watershed. On the other side low amount of soil erosion (<1 t ha-1 year -1) was found along the hilly tract of dense forest cover and plantation areas.
Keywords:Rusle; Soil Erosion; GIS; Watershed; Terrain; Hilly Tract
Introduction
One of the serious and continuous endemic environmental problems is soil erosion and land degradation particularly in the third world country where agriculture is the main stay of the economy. More than 50% of the total area of India is affected by land degradation resulting from soil erosion [1]. Around the globe every year more than 75 billion tons of soil is removed from agricultural land due to erosion [2]. Erosion is the progressive removal of soil or rock particles from the parent mass by a fluid agent [3]. The forms of soil erosion are mainly sheet, rill and gully erosion. Intensity of this erosion widely varies spatially and temporally depending on morpho-climatic and pedo-geomorphic factors [4]. The amount of soil erosion is measured on the basis of two models viz., physical based and empirical based model. GIS and remote sensing (RS) provide spatial input data to the empirical model and predict the potential soil erosion rate. By using the different type of models many scholars have worked on soil erosion throughout the world [5-9]. The most commonly used empirical model is Universal Soil Loss Equation (USLE) developed by Wischmeier and Smith in 1965 for measuring sheet and rill erosion [6]. Revised Universal Soil Loss Equation (RUSLE) uses the same empirical principles as USLE; however, it includes numerous improvements, such as monthly factors, incorporation of the influence of profile convexity/concavity using segmentation of irregular slopes, improved empirical equations for the computation of LS factor [10,11]. In this study, IRS LISS III image has been used for generating C factor by using Normalized Difference Vegetation Index (NDVI). The present study is an attempt to focus on the estimation of soil erosion in the upper Kangsabati watershed by RUSLE model.
Location and Description of the Study Area
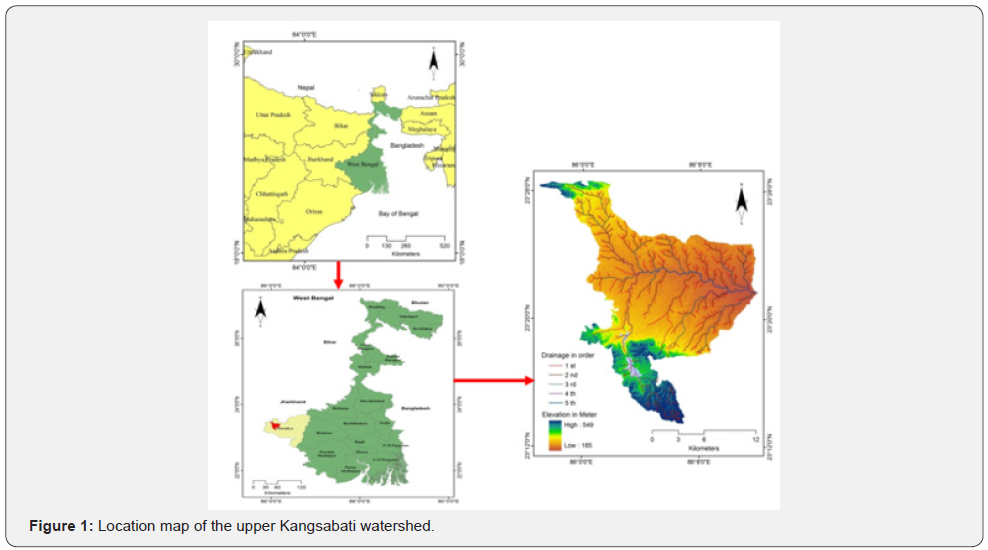
The upper Kangsabati (also known as Kasai) watershed is located in Puruliya district in the state of West Bengal, India (Figure 1). It is extended between 23°13’26”N to 23°28’33”N latitude and 85°17’18”E to 86°11’56” E longitude. The catchment area of the study site is about 276.19 km2. The river originates near Jhalda of Puruliya district. Regionally the study area is part of Chotanagpur Gneissic Complex (CGC), in which rock formation belongs to Archaean age, which is the oldest rock formation of the district [12]. The soils in the study area are mainly fine-loamy, coarse-loamy and loamy-skeletal (ICAR, 1991). The average annual rainfall in this watershed is 1393 mm and the annual mean temperature is 25.6°C with mean summer and mean winter temperature are 29.0°C and 21.3°C respectively [13]. Topographically the area is characterized by undulating rugged hilly terrain exhibiting highly dissected pedimental landscape and lateritic upland with skeletal soil.
Materials and Methods
In this study, GIS plays a major role to prepare different types of thematic map and estimation of soil erosion rate. For the present study different type of data are collected from different sources. These are mainly numerical data, thematic maps etc, which help to analysis the research work. Rainfall data of five years (2012-2016) obtained from India Meteorological Department (IMD), soil data obtained from National Bureau of Soil Survey and Land Use Planning (ICAR, 1991). Topographical sheets (73I/3, 73I/4, and 73E/15, scale of 1:50000) published by Survey of India (SOI), Shuttle Radar Topography Mission (SRTM) 30 m resolution and IRS LISS III satellite image have been used for the study. ArcGIS 10.3 and ERDAS Imagine 14.0 are used for the creation of a digital database, data integration and analysis. After correction the DEM in GIS platform, it has been used to prepare the slope map. Later DEM and slope map are used to prepare LS factor. IRS LISS III data along with topographical sheets have been used to prepare detailed land use land cover (LULC) map.
Soil Erosion Estimation Model RUSLE
The Revised Universal Soil Loss Equation (RUSLE) model has been adopted to estimate the annual soil loss and the equation (Equation 1) is as:
A = R X K X L X S X C X P (1)
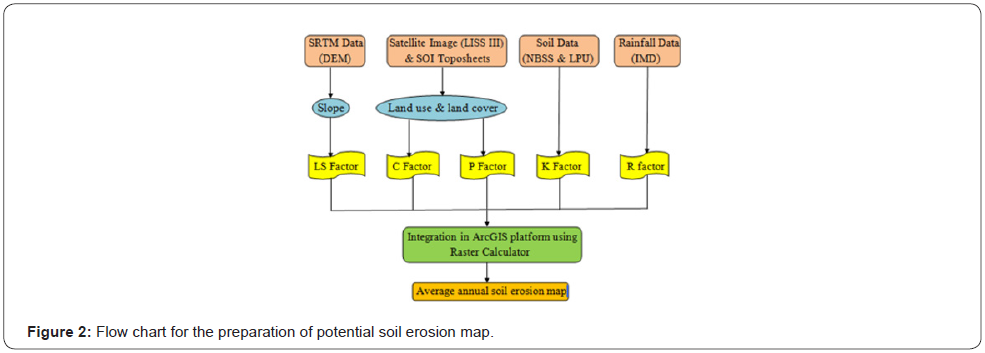
Where, A is the average annual soil loss per unit area expressed in tones/ha/year (t ha-1 year -1); R is the rainfall– runoff erosivity factor (MJ mm ha-1 h-1); K is soil erodibility factor (t ha h MJ-1 mm-1); L is the slope length factor; S is the slope steepness factor; C is the cover and management factor and P is the support and conservation practices factor. Flowchart (Figure 2) showing the methodology adopted in this research study.
Rainfall Erosivity Factor (R)
Rainfall erosivity factor is the annual total value of the erosion index (EI30) for a location [14]. Rainfall intensity represents the principal factor of kinetic energy and to estimate the rainfall erosivity [15]. If the intensity and duration of rainfall increase the value of R factor also increases. In this study, [16] established empirical equation (Equation 2) which has been used for estimating annual rainfall erosivity. The linear relationship of erosion index is:
Ra = 79 + 0.363 X P (2)
Where, Ra is the average annual rainfall erosivity factor (MJ mm ha-1 h-1) and P is the rainfall (mm). The average annual rainfall data recorded by India Meteorological Department (IMD), Pune, at three rain-gauge stations located in the surrounding area of upper Kangsabati watershed for over a span of five years (2012-2016) has been used for calculating R factor (Table 1). Spatial distribution of R factor has been obtained using Inverse Distance Weighted (IDW) interpolation techniques.

Soil Erodibility Factor (K)
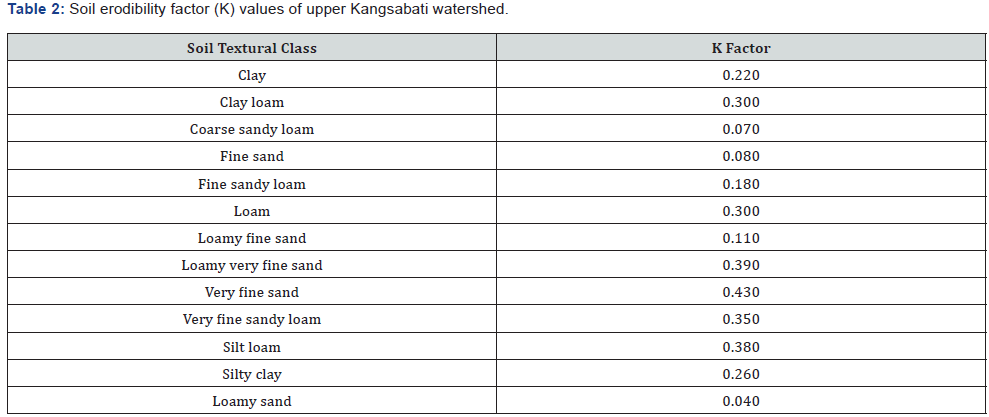
Soil erodibility factor is a measure of potential erodibility of soil and it depends on the inherent properties of the soil. The K factor is related to the integrated effects of rainfall, runoff and infiltration on soil loss, accounting for the influences of soil properties on soil loss during storms action on uplands areas [17]. Taking into consideration the Soil texture, organic matter and permeability soil erodibility factor (K) has been calculated. Based on the map produced by National Bureau of Soil Survey and Land Use Planning [18] for the district of Puruliya, K values of different soil type in the study area have been estimated. Thirteen types of soil classes (Table 2) in the study area have been identified and values are imputed to respective classes of soil.
Topographic Factor (LS)
Topographic factor includes slope length factor (L) and slope steepness factor (S) which mainly reflect the effect of surface topography on erosion by water action [19,20,14]. Slope length (L) and slope steepness (S) have been derived by using SRTM DEM (30 m resolution) in ArcGIS 10.3 platform. Slope length factor (L) has been calculated on the basis of following equation (Equation 3) given by [21] which is:
L =( λ/22.13)m (3)
Where, L is the slope length factor; λ is the slope length in meter; m is the variable slope-length exponent. 22.13 is the RUSLE unit plot length in the meter. The slope steepness factor (S) is evaluated based on the relationship (Equations 4.1, 4.2) given by [21] for slope length longer than 4 meters:
S =10.8sinφ + 0.03when s <9% (4.1)
S =16.8sinθ − 0.05when s ≥9% (4.2)
Where, S is the slope steepness factor which is dimensionless and θ is the slope angle in degree.
The LS factor is calculated by multiplying L and S factor together (Moore and Burch, 1986) in raster calculator in ArcGIS platform with the help of following equation (Equation 5):
Cover - Management Factor (C)
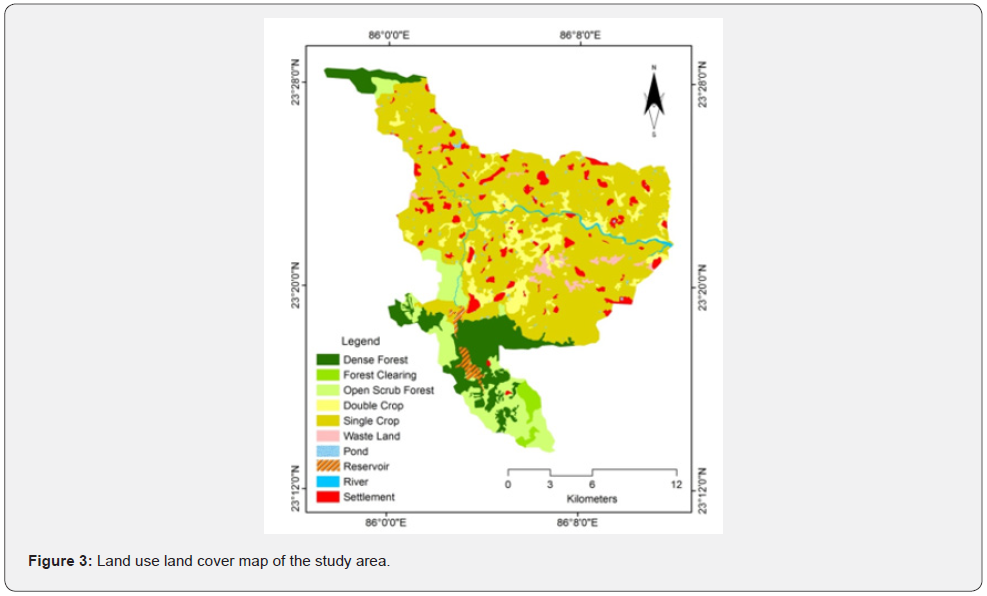
The cover and management factor is dimensionless which is an important factor for reduction of soil erosion and it depends on land use pattern of an area [22,23]. The C factor is the ratio of soil loss from an area with protective cover and management to soil loss in the continuous clean tilled fallow land [24]. The values of C factor vary from 0 to 1 based on land use land cover types excluding areas of water body [25]. Land use land cover map (Figure 3) of the study area has been prepared with the help of LISS III image and toposheets (SOI) which is the primary determining for estimation of C factor. In this study, Normalized Difference Vegetation Index (NDVI) was used to calculate the C factor. The equation (Equation 6) for calculating the NDVI (Rouse et al. 1974) is:
NDVI = (NIR − RED) / (NIR + RED) (6)
After producing NDVI image, following equation (Equation 7) has been used to create C factor map and this is:
C =1.20 −1.21*NDVI
Support Practice Factor (P)
The support practice factor (P) is the most important parameter in RUSLE method and it is a dimensionless factor [24] defined P factor as the ratio of soil loss in a particular support practice to the corresponding soil loss with up and downslope cultivation. P-value ranges from 0 to 1, where the value 0 indicates good erosion resistant facility made by man and the value 1 indicate an absence of erosion resistant facility. From the previous study it has been assigned that land with P value of 0.28 as agricultural land and land with P value of 1.0 as non
Result and Discussion
Spatial Distribution of Soil Erosion Factors
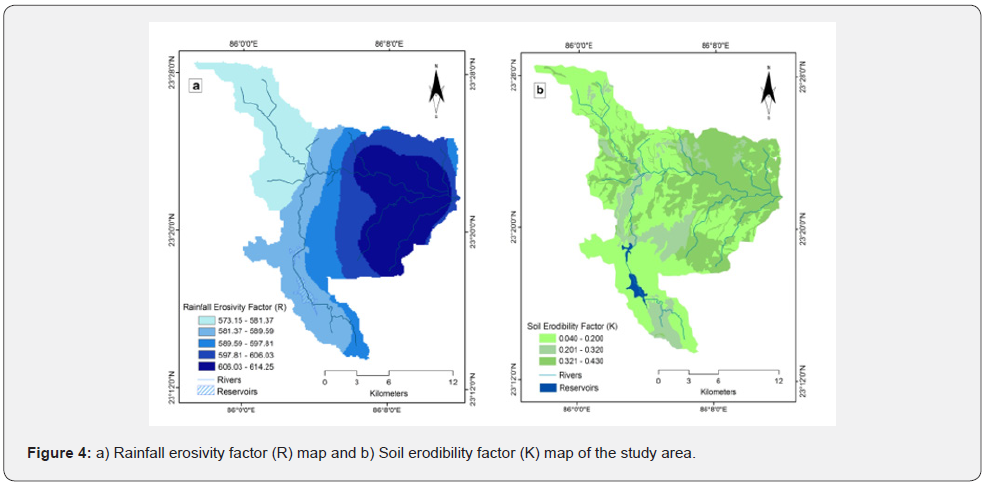
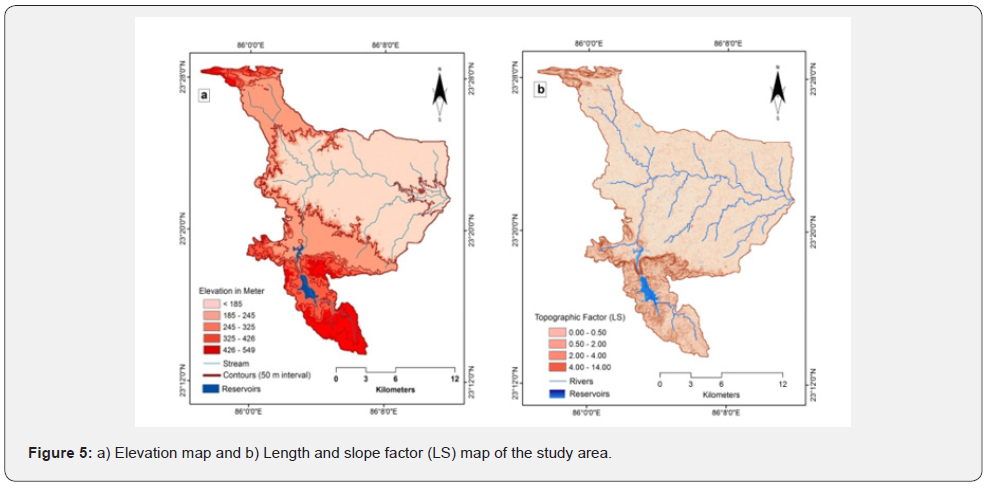
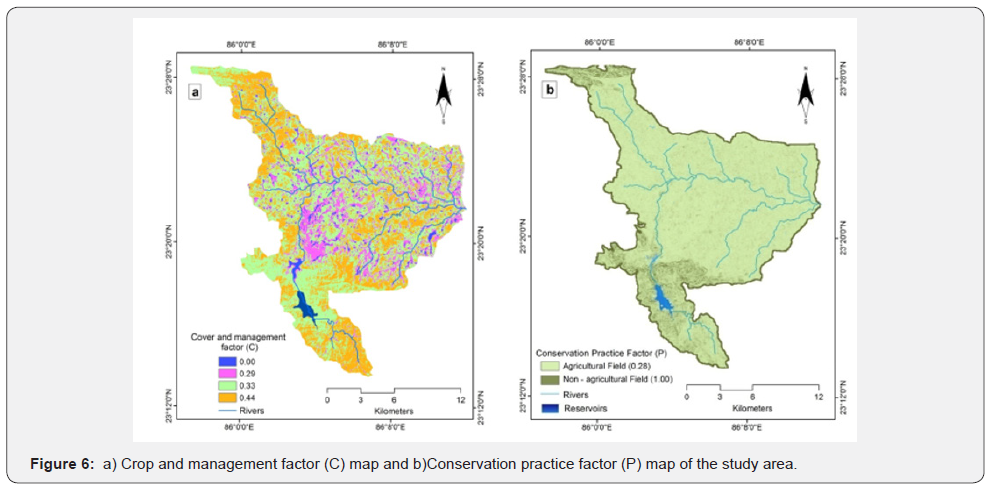
The average annual rainfall erosivity factor (R) for the years 2012 - 2016 vary in the ranges of 575.55 to 616.64 MJ mm ha-1 h-1. The R factor map (Figure 4a) showing that the downstream portion or eastern part of the study area has high rainfall erosivity because this area received the highest amount of rainfall. On the other hand, northwestern and southern parts of the watershed have low rainfall erosivity due to slightly low rainfall and presence of vegetal cover. The rate of soil erodibility is very high if the soil texture is fine. Presence of organic matter into the soil is a dominant controlling factor of soil erodibility. It is established fact that soils with less than 3.5% organic matter are considered to be erodible [26,27]. In the study area, the value of K factor ranges from 0.040 to 0.430 (Figure 4b). Very fine sand, sandy loamy and silt loamy having a higher value of K in the study area which is more prone to erosion. Upper northeastern part of the study area is more vulnerable to erosion where K value ranges from 0.321 to 0.430. On the contrary, in the high relief area and middle part of the study area K value is low (0.040 to 0.200). In the upper Kangsabati watershed, the range of elevation varies from 185m to 549m (Figure 5a). It is mention that higher the LS value greater the potentiality to erosion. Based on the LS value the whole study area classified into four categories where values range from 0.00 to 14.00 (Figure 5b). The most part of the watershed is characterized by low value of LS factor but here as a matter of fact that the rate of soil erosion is moderate to very high due to high drainage density. Land use land cover map of the study area may be classified into ten categories, where settlement area, agricultural land, and wasteland are more prominent in the erosion-prone zone. C factor in the study area has been computed by using NDVI. The value of C factor ranges from 0.00 to 0.44 (Figure 6a). P factor generally depends on different practices which have been undertaken for control of soil erosion. At the time of field visit in the study area, it has been found that farmers are practicing some conservation method like creating bunds, gully plugging around the agricultural field. In addition, efforts are on to increase the vegetal cover by using percolation tanks, minor irrigation tanks. In this study P factor (Figure 6b) values are taken in two type viz., agricultural field (0.28) and non-agricultural field (1.0). agricultural land [28,24,29].
Estimation of Potential Soil Erosion (A)
The Revised Universal Soil Loss Equation (RUSLE) is an empirically based model and has been used to generate the potential soil erosion map by multiplying its five factors in raster format. The potential soil erosion of the upper Kangsabati watershed varies from < 0.014 to 13.42 t ha-1 year -1 (Figure 7) and it is classified into four soil erosion zones. These zones are low (< 0.014 t ha-1 year -1), moderate (0.014 – 1.0 t ha-1 year -1), high (1.0 - 5.0 t ha-1 year -1) and very high prone zone (5.0 – 13.42.0 t ha-1 year -1). In the whole watershed it is found that nearly 45% area is under very high and high erosion prone zone [30-36].
Conclusion
The Revised Universal Soil Loss Equation (RUSLE) is a very useful technique to quantitatively measure the average annual soil erosion in a watershed. To estimate the spatial distribution of soil erosion prone zone, RUSLE model could be integrated with GIS techniques. Various thematic layers were generated for the study area using various tools available in GIS techniques to find out the result. In the upper Kangsabati watershed, very high and high amount of soil erosion prone zone is observed in northeastern part of valley fill and intervalley fill of single crop lands where drainage density is high. On contrary, low and moderate soil erosion zone observed in the hilly tract with dense forest and open scrub forest covered areas. The land use land cover changes have an effect on increasing soil erosion rate. With the passage of time clearing of forest cover in the hilly track and changes in crop patterns have an effect to increasing soil erosion rate. Thus, in the hilly areas where clearing of forest has been cleared off, soil conservation practices must be adopted to control soil erosion. In the agricultural areas, soil conservation practices like terracing, agro-forestry, bunding, crop rotation etc. techniques must be adopted with more precise method for soil conservation. It is observed that large part of the watershed is sloping plain land which has a slope up to 5°C. The land is mostly used for single crop agriculture and it is the land of maximum soil erosion. This zone has maximum number of 1st and 2nd order streams for which rate of soil erosion is high. If soil erosion from the agricultural land continues at present rate, then it may lead to soil degradation and ultimately cultivable land will become unfit for cultivation. Rate of erosion may increase in future due to continuous forest degradation for extension of agricultural land and to some extent over grazing. To overcome these problems different type of soil and water conservation measure is necessity as soon as possible.
To know more about Juniper Publishers please click on: https://juniperpublishers.com/manuscript-guidelines.php
For more articles in Open Access Journal of Environmental Sciences & Natural Resources please click on: https://juniperpublishers.com/ijesnr/index.php




Comments
Post a Comment