Natural Resource Mapping Using Landsat and Lidar towards Identifying Digital Elevation, Digital Surface and Canopy Height Models -Juniper Publishers
Juniper Publishers- Open Access Journal of
Environmental Sciences & Natural Resources
Natural Resource Mapping Using Landsat and Lidar towards Identifying Digital Elevation, Digital Surface and Canopy Height Models
Authored by Abdul Qayum
Abstract
The evaluation of the natural resource plays a decisive role in management and sustainable developmental planning. The study aims to generate natural resource based maps of rural areas of the USA using remote sensing datasets such as Landsat and LiDAR to analyze generated natural resources for developing digital elevation (DEM) and canopy height models (CHMs). Natural resource maps were generated using Landsat image of the year 2010. The area statistics reveal that the tree class percent (23.21 %) was the second highest after fallow land class (60.44 %) whereas shrubs and grass/agriculture was 6.59 % and 6.47 %, respectively. Later, LiDAR datasets for the same time were used to generate DEM/surface models (DSM) and CHMs. Spatial analysis was done to attempt hypothetical queries pertaining to resource management. Further, all the generated datasets from different sources including slope map, drainage map etc can be integrated in GIS domain for effective decision making. Coarse resolution Landsat data can be effectively used to monitor natural resources up to micro level if used skillfully in conjugation with rectified images. LiDAR datasets have huge potential to generate highly accurate DEM, DSM and CHMs. Such accurate data will be informative for qualitative and quantitative assessment of various natural resources.
Keywords: Canopy Height model; DEM; DSM; Landsat; LiDAR; Natural Resource Map
Introduction
The natural resources signifying available land, water and forest have been serving the mankind by providing valuable services like food items, fuel and fodder, important medicines, regulating the air and water currents, protecting the soil and its components etc. FAO [1]. Moreover still the rural livelihood in every country is dependent on these natural resources and its condition for their sustainability and livelihood World Bank [2]. The major factors like population growth agriculture expansion and increased human well-being have been at the cost of forest depletion. The exponential increase in human population from seven billion to nine billion in the coming years has increased pressure on natural resources which are depleting at a faster rate than expected Millennium Ecosystem Assessment [3]. Further, the analysis of Ivanova et al. [4] has confirmed that some of the ecosystem services are at stake. We may soon face water scarcity, flooding of cities (because of degradation of wetlands) and increase in temperatures (because of overgrazing and overexploitation of forest trees).
Sustainable use of the natural resources would prevent further loss. As defined by Norwegian Ministry for the Environment [5] Sustainability means "the use of services and related products which respond to essential needs and ensure a better quality of life while minimizing the utilization of natural resources and toxic materials as well as control the emissions of waste and pollutants over the life-cycle so as not to jeopardize/ threaten the needs of future generations". Thus, a detailed management plan for the natural resource is needed which would identify clear objectives, evaluate existing natural resources and its uses to develop long term plans. To achieve this, a reliable geo-information database is required to prepare action plans for sustainable development at micro level. Natural resources assessment can be made using these parameters which would help the forest managers in multiple ways Hudak et al. [6]. These days satellite remote sensing data like LANDSAT, LiDAR etc are available for free download, which open up the opportunity for many researchers, government authority, and stakeholders for creation of data base on natural resources Kennaway et al. [7].
The advances in satellite remote sensing technology since few decades have been successful in providing data for detailed inventory and mapping of natural resources at large scale Kasturirangan et al. [8]. The applications of satellite remote sensing data have either been images from passive optical sensors for example aerial photography and Landsat Thematic Mapper Goward & Williams [9], or lesser known active radar sensors such as RADARSAT Waring et al. [10]. Light Detection and Ranging (LiDAR) has drawn tremendous attention among different natural resource managers and planners Hudak et al. [6]. LiDAR data provides the required resolution and detail of forests, rangelands, watersheds, roads, and other valued resources to improve management related decision supporting system Falkowski et al. [11]. LiDAR characterizations of ground and vegetation attributes are consistently accurate, highlighting its potential for various applications Deekshatulu [12]. LiDAR uses an active illumination sensor and can be collected in day or night. Besides, LiDAR data is free of any geometric distortions like side-looking radar. The capacity of LiDAR to capture multiple returns and to penetrate the ground even in dense forested areas opens the opportunity for the generation of a digital terrain model (DTM) and facilitates the estimation of variables Lim et al. [13], Hyyppa et al. [7]. Natural resource inventory at national or regional level can tap the potential of LiDAR data.
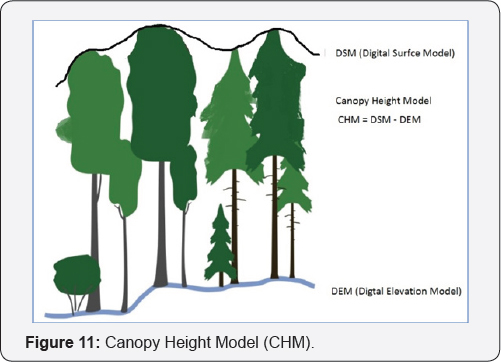
The advantages of LiDAR data over traditional remote sensing data is that data can be collected rapidly with greater accuracy (up to the centimeter), surface data has a higher sample density which helps in improving the results for various applications. In a forest, it can collect elevation data where photogrammetry fails to exhibit the accurate terrain surface due to the dense tree canopy cover. It adds another dimension that is "z" dimension to the spatial analysis and also increases the accuracy of biophysical parameters. Its sensors provide data regarding spatial distribution of plant canopies, sub canopy, vegetation height cover and canopy structure Lefsky et al. [14]. A Digital Surface Model (DSM) and the correspondent Digital Elevation Model (DEM) can be used in combination to retrieve by differencing the commonly known Canopy Height Model (CHM). It is a measure of the trees height over the area of interest as in case of woody vegetation or forest. CHM can be utilized to assess many fundamental forest parameters such as tree biomass and volume. Thus is gaining importance in identifying canopy height variability and detecting tree crowns Jakubowski et al. [15], Qin et al. [16].Other features pertaining to forest structure like canopy height, basal area, timber volume and biomass have all been successfully derived from LiDAR datasets Drake et al. [17], Drake et al. [18], Hyde et al. [19], Lefsky et al. [20], Magnussen & Boudewyn [21], Means et al. [22], Naesset [23], Nelson [24], Nilsson [25], Peterson [26], Asner et al. [27].
The LiDAR data can be used in conjunction with other open source data such as Google Earth. The pros of using Google Earth is that it provides freely available high resolution satellite data, which is useful for visual interpretation and delineation of various features Bey et al. [28], Malarvizhi et al. [29]. It also facilitates creation of vector layer for the area of interest and further exporting it in GIS domain can be used as a base map. It provides information (images of different time periods) for temporal analysis and one can also assess the history of a place Bey et al. [28]. All these provide insight about changes taking place with regard to natural resources. The cons of Google Earth are that one cannot obtain the original multispectral band data which limits the image classification analysis and quantification of data. The present study has attempted to generate base maps using a combination of Google Earth, Landsat and other thematic maps and to assess their feasibility to evaluate LiDAR dataset. The study area chosen was a rural area segment of the United States of America (USA) based upon the availability of both Landsat and LiDAR data. Different themes such as DSMs DEM and canopy height model (CHM) were generated using LiDAR dataset.
The Study Area
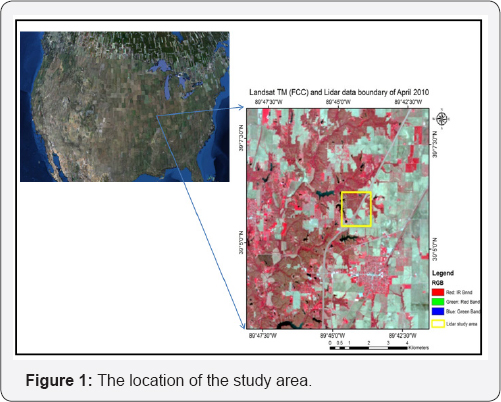
The study area was chosen based upon the availability of free download of LiDAR and Landsat remote sensing data for the same area of interest. It is located in rural USA, which is mostly dominated by trees, shrubs, wetlands (ponds, lakes, other water bodies) and agriculture. The geographical coordinates of the study area ranges from its Latitude 39°02'43.37"N to 39°08'47.71"N and Longitude 89°40'42.71"W to 89°49'07.83"W, whereas total geographical area is 136,81.4 Ha and its elevation ranges from 131 m to 236 m from the MSL (Figure 1).
Material and Methodology
Satellite data acquisition and preprocessing
The satellite remote sensing data of Landsat (April, 2010) and LiDAR (April, 2010) were downloaded from the USGS Earth explorer portal. The Landsat data was radio metrically and geometrically corrected and was devoid of cloud cover and line drop outs. The image processing, interpretation and delineation of different classes of natural resources was done in image processing software ERDAS Imagine, which is designed especially for remote sensing (Figure 2).
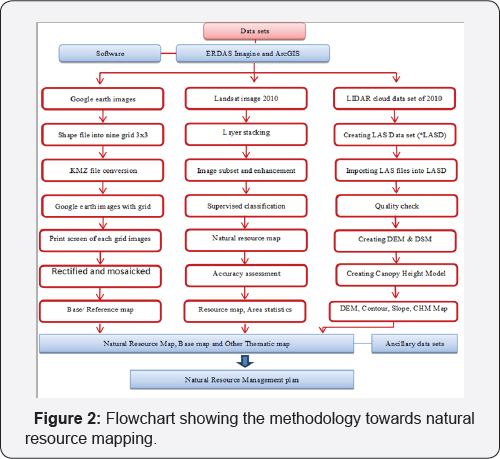
LiDAR data was analyzed in ArcGIS (developed by Environmental Systems Research Institute (ESRI)) platform, which is software used to create, display and analyze large geospatial data. Prior to accessing the images from the Google Earth, the study area shape file was created in ArcGIS and was divided into nine grids which were converted to *kmz file. This file was opened into Google Earth for visualizing. Each of the nine grids of Google Earth images were projected and mosaic ked in ERDAS Imagine. This mosaic ked file was used for creating the base map. The detailed schematic flowchart was formulated (Figure 2).
Image Processing and Classification
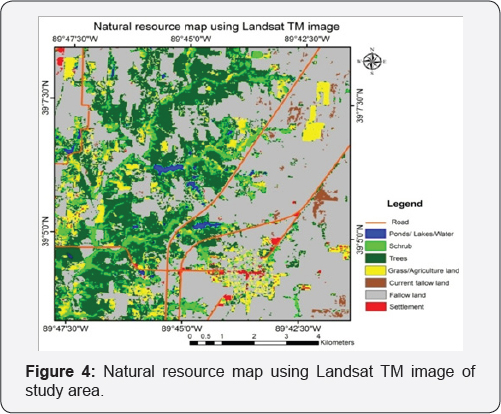
Landsat data was further subjected to image enhancement and classification to delineate various natural resource classes. For each class, (in false colour composite-FCC) some 10-15 clearly visible training sets were given, which were uniformly distributed throughout the scene. Supervised classification was performed using maximum likelihood algorithm. Seven natural resource classes namely trees, shrub, grassland/agriculture, settlement, water, current fallow and fallow were delineated in the study area. Anderson classification scheme (level I) was achieved by identifying seven natural resource categories in the Landsat image Anderson et al. [30].
Image accuracy assessment
Accuracy assessment determines the quality of the classified image. The accuracy assessment was executed by generating random points for each class in the classified dataset. The points were assigned to the respective classes based on the literature sources. The error matrix was generated and the overall classification accuracy and kappa statistics were calculated.
Base map preparation from the Google Earth
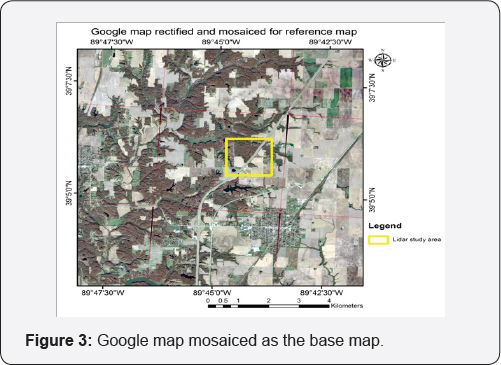
The study area vector (shape) file was divided into nine grids (3x3) in ArcGIS. The Shape file was converted into kmz file. This file was then opened in Google Earth containing all the nine grids. Each Google Earth image was rectified and mosaiced in ERDAS imagine. These mosaic images were taken as the base map. The advantage being that all features were distinct and can be visually interpreted and assist in further analysis.
LiDAR Data Analysis
LAS is the file format for LiDAR point clouds and the maiden step was to add LAS tiles into an LASD dataset, which was done in Arc Catalog by selecting NEW/LAS Dataset. By using LAS data set properties dialogue box, statistics can be created by clicking update button. This will provide a very useful overview on the point cloud data. The points can be viewed as Elevation values. Downloaded LiDAR data set were evaluated to run a quality assessment/ quality control (QA/QC) process on the data to ensure the data meets the delivery specifications. Such a process can also highlight the areas where the point density falls below a threshold level or data points falling below ground level, as well as the quality of the point classification.
All these aspects can affect the output data from any LiDAR processing undertaken. ArcGIS has quality control features for LiDAR point data within the LAS Point Statistics as Raster tool was used to evaluate the quality of data. The datasets in the study has no major issues as highlighted by the QA/QC process then the next step was to generate outputs in form of Digital Elevation Model (DEM) Digital Surface Model (DSM) Canopy Height Model (CHM), Contours and Slope etc. DEM and DSM can be created using LAS Dataset to Raster tool setting the DEM and DSM parameters; respectively. A critical element in natural resource management is the ability to measure tree heights. CHM is derived by subtracting the DEM from the DSM and can be done using the minus function of LIDAR Processing of Arc Toolbox.
Spatial Analysis over Datasets
Once different spatial data sets generated from data source rectified images can be used for spatial analysis quarries as they retain its geometry and projection. To understand this, an example may be taken as if a resource manager is interested in knowing the answer of following questions:
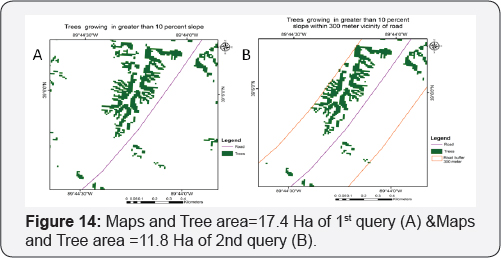
a. Simple query: Maps and area of trees growing on more than 10% slope; this slope is vulnerable due to its steepness towards erosion and needs special attention as regards soil and water conservation. This query needs two layers of natural resource maps and a slope map.
b. Complex query: Maps and area of trees growing in more than 10% slope and is vicinity of 300 m of road; this slope is more vulnerable due to its steepness towards soil erosion as well as accessibility of humans, high priority is required towards soil and water conservation practices. This query needs three layers of natural resource, slope and road buffer of 300 m maps.
Results and Discussion
Accuracy assessment of Natural resource map
The accuracy assessment was performed in classified images generated from Landsat images for the year 2010. The overall classification accuracy was 88% whereas kappa statistics was 0.80.
Base map preparation
The base maps provide information regarding various land features with considerable accuracy to give a lead to further analysis and interpretation. In this case, the downloaded, rectified and mosaic ked images of Google Earth acted as the base map as all the different features were quite distinct (Figure 3). Roads were digitized on it, which guided in supervised classification process for delineating various natural resource classes for the Landsat data (Figure 3).
Natural resource map class analysis
A natural resource map shows the expanse of natural resources found on and in the surface of the Earth. Based on the classification of Landsat data, natural resource map were generated for the study area, which was dominated by class trees, shrubs, water, grass/ agriculture, current fallow, fallow and settlement (Figure 4).
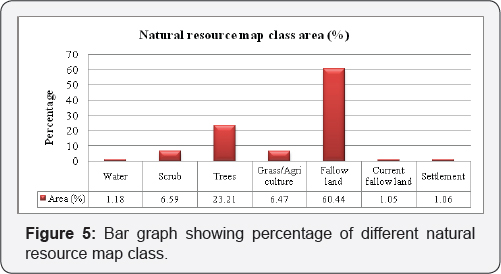
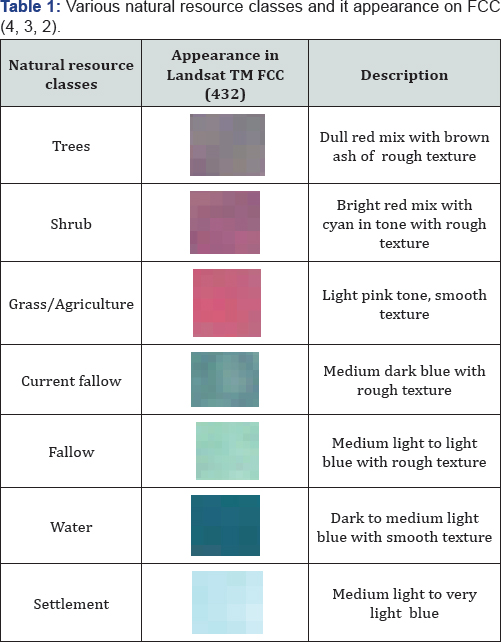
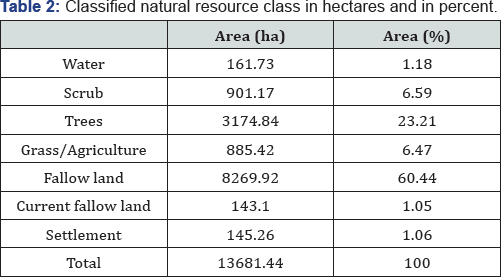
The Landsat TM data was visually interpreted based on the appearance of these classes in terms of colour and texture. They were used as signature (training sets) required for supervised classification of the dataset. A brief description of various features is given in (Table 1). The area and percent of each class was also calculated and the trees class percent was found to be the second highest after fallow land percent whereas shrub and grass/agriculture percent was 6.59 and 6.47, respectively (Table 2 & Figure 5).
LiDAR Data Analysis
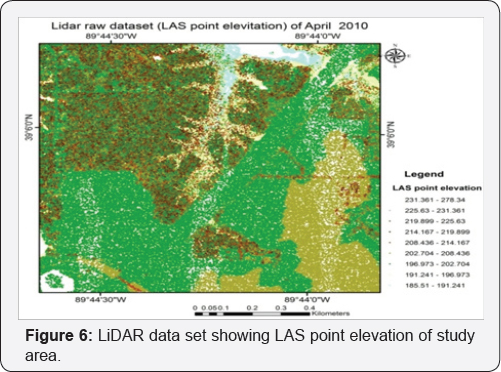
The evaluation of QA/QC of LiDAR data was performed to check point density falling below a threshold level or not and it was found satisfactory (Figure 6).
DEM generation
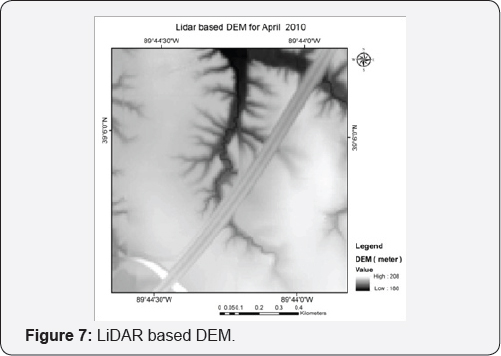
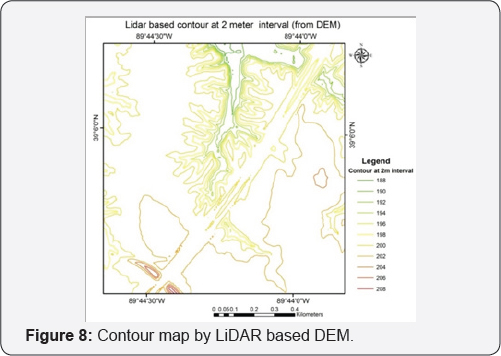
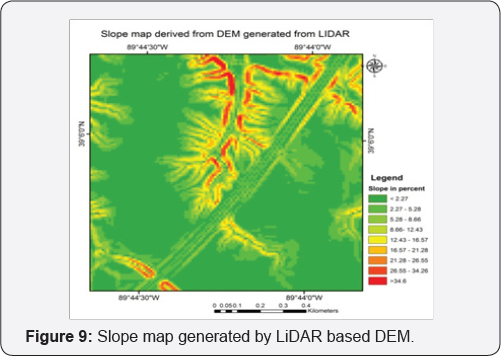
In order to create DEM, the parameters need to be set on the LAS Dataset then to Raster tool. LAS require classification codes and returns to be defined. It varies depending on the product being derived. For a DEM, in the Layer Properties dialogue box Filter tab, the Classification Code should be set to 2, Ground, and the Returns set to 'ALL', and the DEM may be generated (Figure7). The contour (Figure-8) and slope map (Figure 9) were also generated based on this DEM (Figures 7-9).
DSM generation
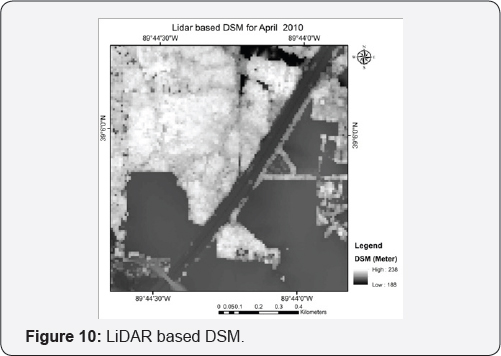
Similar steps were followed to create DSM except that the LAS Dataset parameters in the Layer Properties dialogue box Filter tab were set to the classification code as set to 'All Classes', except 7 Noise and Returns set to 'First of Many; Single Return and Return 1'. Consequently, the DSM can be obtained (Figure 10).
Canopy Height Model generation
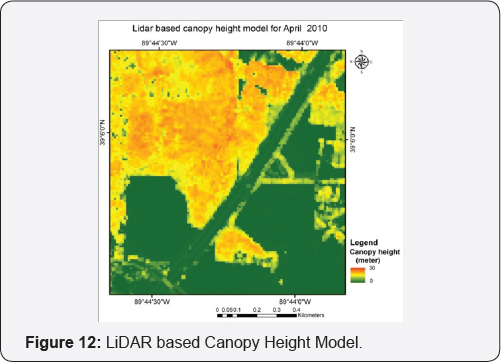
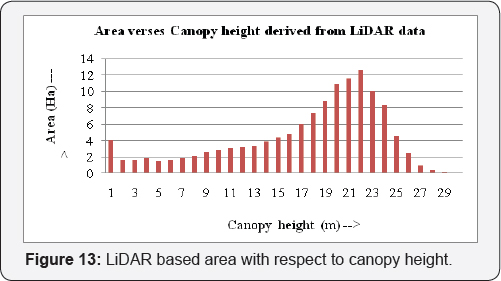
LiDAR technology has the ability to generate tree heights which is a critical element in natural resource management. Canopy model was derived by subtracting the DEM from the DSM (Figure 11). CHM gradient varies from 0 to 30 m was found (Figure 12). The area with respect to canopy height was also estimated (Figure 13). Furthermore, it was also estimated that the canopy height 22m occupied the maximum area (Figures 11-13).
Spatial Analysis over datasets
For answering queries, road buffer of 300 m was created from road map whereas slope map was grouped into two classes (one greater than 10% and other less than equal to 10%) and classified natural resource map was grouped into two classes (one tree class and other into other than tree class). The maps and area statistics was prepared based on spatial quarry as per the requirement from the resource manager (Figure 14).
Conclusion
The above study has shown that the prospects of mapping natural resource based upon Landsat images, LIDAR data sets and Google map in conjugation as reference map are better than the traditional remote sensing analysis. It has enhanced the mapping ability with more accuracy. The responses of LiDAR address a detailed measurement of all surfaces within a canopy volume which includes foliage, branches and stems. It has the capacity to accurately analyze the forest variables at landscape level and has been found to show more precise and cost effective measurements as compared to the traditional field related studies. At the local level that is at village level, such data can be harnessed for the betterment of rural people. This type of analysis can be incorporated in the making of the Natural Resources Management Plan (NRMP), which requires to the study the natural resource extent, problems and issues and recommending appropriate measures. Utilizing LiDAR data in an appropriate and judicious manner would open an opportunity for sustainable forest management practices by enhancing the existing knowledge and extending the expertise amongst the forest management community.
For more articles in Open Access Journal of Environmental Sciences & Natural Resources please click on: https://juniperpublishers.com/ijesnr/
To know more about Open Access Journals Publishers
To read more…Fulltext please click on: https://juniperpublishers.com/ijesnr/IJESNR.MS.ID.555580.php




Comments
Post a Comment