Application of Aquifer Parameters in Evaluating Groundwater Potential of Logo Area, Benue State, Nigeria - Juniper Publishers
Juniper Publishers-Open Access Journal of Environmental Sciences &
Natural Resources
Application of Aquifer Parameters in Evaluating Groundwater Potential of Logo Area, Benue State, Nigeria
Authored by Diloha II
Abstract
Logo Area has a complex hydrogeological terrain resulting from its geology which comprises basement complex and low permeability Cretaceous sediments of Middle Benue Trough of Nigeria. This work was targeted at evaluating the groundwater potential of the study is a using pumping test data. Constant rate pumping test with single well was carried out in twenty boreholes at selected locations. The transmissivity values were computed from the pumping test data using Cooper and Jacob [1] Method and analyzed through descriptive statistical testing and Krasny Transmissivity Classification Scheme (KTCS) for the determination of Transmissivity variations and spatial distribution of the groundwater supply potential of the area. The result of transmissivity analysis based onde scriptive statistical testing shows that 65%, 20%, 10% and 5% of the boreholes are covered under background transmissivity, negative, positive and extreme positive anomalies respectively. Further analysis of tansmissivity using KTCS reveals that the study area is a considerably heterogeneous hydrogeological environment possessing groundwater potentials for limited supply (very low transmissivity), private supply (low transmissivity), local supply(intermediate transmissivity) and lesser regional supply (high transmissivity).
Keywords:Aquifer Parameters; Hydrogeology; Groundwater; Nigeria
Abbrevations: KTCS: Krasny Transmissivity Classification Scheme; VLT: Very Low Transmissivity
Introduction
Background Information
is essential for reliable and economic provision of safe water supplies in both the urban and rural environments for sustainable development of any economy Adelana et al. [2]. However, its occurrence and distribution is basically controlled by geological factors such as lithology, texture and structure of the rocks as well as hydrological /meteorological factors like stream flow and rainfall Nwankwoala [3]. The numerous variations in the quantity, quality, accessibility and renewability of groundwater resource are predicated on interactions of the geology of the area, geomorphology/weathering and rainfall [2]. Transmissivity is one of the most effective aquifer derived parameters used for groundwater appraisal and evaluation especially when there is no observation well. Logo Area is largely underlain by low permeable Cretaceous sediments of middle Benue Trough of Nigeria comprising shales, siltstone and ferrogenous sandstones with few basement complex exposures arbitrarily distributed in some communities located northwest Offodile [4]. The area is hydro geologically complex due to its geology. Based on desk and field studies, the hydrogeology of Logo Area in respect of its groundwater supply potentials and their spatial distribution are little known thereby leading to improper siting and drilling of boreholes within the area. As a result, unproductive boreholes are ubiquitous in the area. This results to acute shortage of water supply for domestic use especially in the dry season. It is hoped that this study which is targeted at evaluating the groundwater potential of Logo Area through aquifer parameters analyses would provide good information for the drilling of productive boreholes within the study area.
Study Area Description
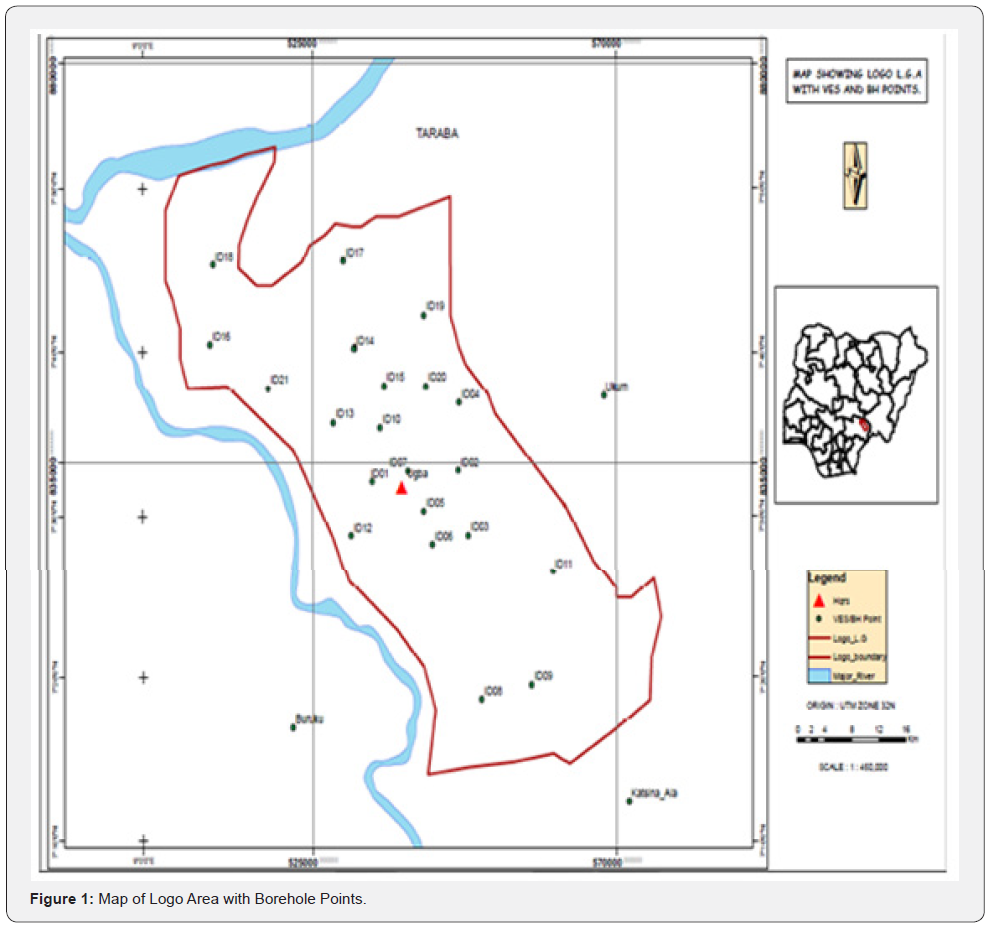
Logo lies between Latitudes 7° 23’ 43” N and 7° 47’ 30”N of the Equator and between Longitudes 9°10’ 23”E and 9° 34’15” E of the Greenwich Meridian (Figure 1). It is one of the Local Government Areas in Benue State, North Central Nigeria. It has an area extent of about 1,408km2 with population density of 169,063 as at the 2006 census. It is bounded to the north by River Benue and Taraba State, to the East by Ukum, to the south by Katsina-Ala and Buruku and to the west by Guma. It could be accessed through four major routes viz:
a) Zaki-Biam - Ugba Road,
b) Amaafu - Ugba Road
c) Yandev - Buruku Road
d) Anyiim - Ugba Road (Figure 1)
Geology of the Study Area
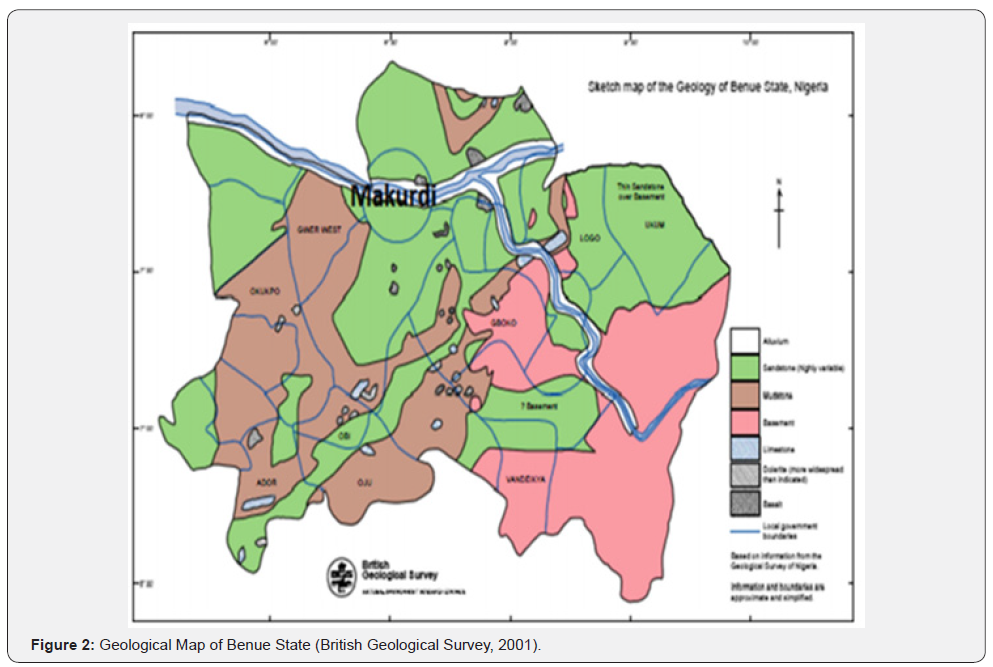
The studied Area is situated in the Middle Benue Trough of Nigeria which consists of the basement complex and six Cretaceous sedimentary formations. The six formations include the Asu River Group (Arufu, Uomba and Gboko Formations), Keana Formation, Awe Formation, Ezeaku Formation, Awgu Formation and the youngest which is the Lafia Formation Patrick [5]. Basement complex, Asu River Group and Awe Formation sare exposed in the area. The Asu River Group has been described by Cratchley and Jones [6], Offo dile [4] Offo dile and Reyment [7] as the oldest marine sediments of Albian age which islithologically composed of Micaceous siltstone, shale, mudstone, clays and fine grained sandstones while the Awe Formation that overlies the Asu River Group islithologically composed of flaggy, pale colored medium to fine grained sandstone with inter bedded carbonaceous shales and clays. On the basis of lithology, Logo Area has been described in the geological map of Benue State by British Geological Survey [8] to have composed of highly variable sandstone, mudstone, limestone and basement (Figure 2).
Methodology
Data Acquisition
Pumping tests were carried out in twenty boreholes located within Logo area for the determination of the aquifer parameters. Constant rate pumping test method with a single well was adopted. This method comprises two phases-the pumping phase and non-pumping or recovery phase. Before the commencement of the pumping test, the static water level was measured using electric water level probe (dipper) and thereafter 1Hp submersible pump was installed and the rise in water level noted. During the pumping phase, the water was pumped at constant rate from a suitable local datum (top of casing) and water level response (drawdown) was measured and recorded using dipper and stopwatch. The flow rate was measured soon after the start of the test, and at intervals during the test using a known volume of container. The dynamic water levels in the borehole was measured in the intervals of 1 minute for 10 minutes elapsed, 2 minutes for 10 minutes elapsed, 5 minutes for 20 minutes elapsed, 10 minutes for 40 minutes elapsed, and 20 minutes for 40 minutes elapsed, making it a total elapsed pumping time of about 120 minutes. The second phase which is the non-pumping or recovery phase started at the end of the pumping phase when the pump was switched off, the stopwatch was restarted and the water level recovery was measured at the same intervals as for measuring the drawdown until water level get to the pre-test level.
Data Interpretation
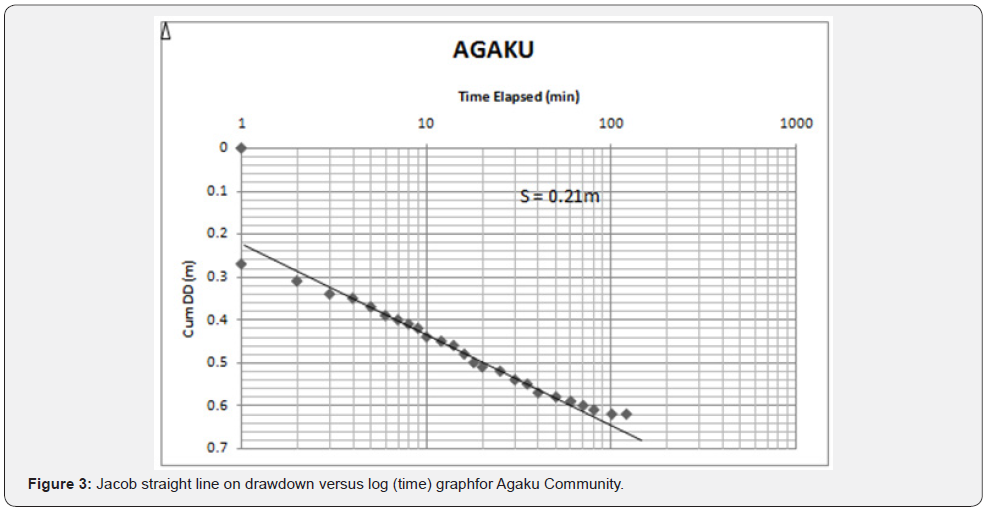
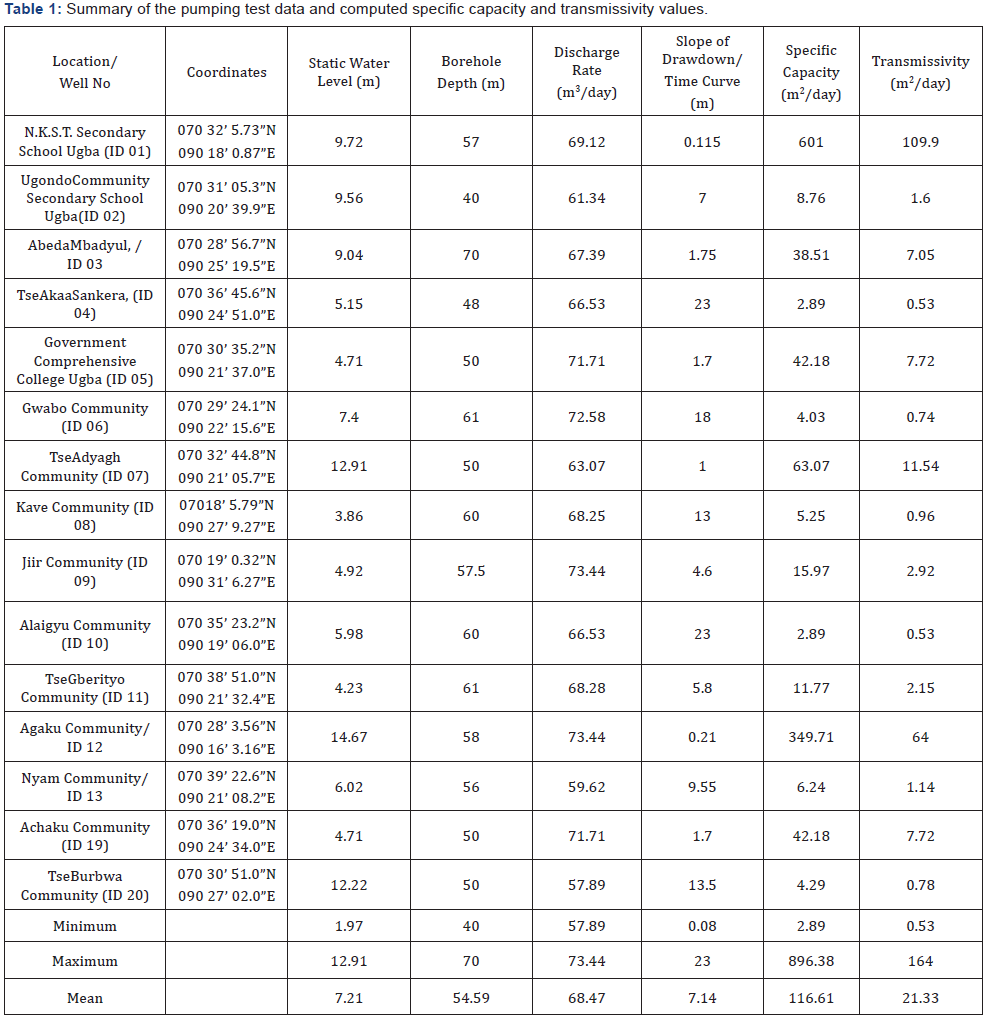
Cooper and Jacob’s solution method was employed for the determination of the aquifer derived parameters (transmissivity and specific capacity) as shown in Table 1. This was done by plotting drawdown and their corresponding time data acquired during the pumping test on semi-log format. The time in minutes was plotted along the logarithmic x-axis while the drawdown was plotted along y-linear axis, while Jacob’s straight line was fitted through the middle and/or later points ignoring the early points because they seem to be affected by the volume of water stored in the borehole itself. The average pumping rate (Q) in meter cube per day (m3/day) for the duration of the test and the slope {which is the change in drawdown over one logarithmic cycle(Δs)} were determined and then incorporated into Cooper and Jacob well flow equation (for single well)} as stated below for the computation of the transmissivity (T) and specific capacity (sc):

Where T is the transmissivity measured in metre square per day.
Q is the discharged rate measured in metre cube per day.
ΔS is the slope of drawdown versus log of time (change in drawdown per logarithmic cycle).
Sc is the specific capacity measured in metre square per day (Figure 3) (Table 1).
Result and Discussion
Analysis of Transmissivity
Transmissivity analysis was carried out using two methods as reflected in Mayooran [9]. One method is based on descriptive statistical testing for identification of background transmissivity and anomalies while the other method is based on Kransy [10] transmissivity classification scheme for appraisal of groundwater supply potential.
Statistical Testing
In this method, all transmissivity values acquired were pooled in a particular region using Transmissivity index (Ý) which relates to transmissivity through the equation stated below:

The Tansmissivity index (Y), is calculated by modifying the above stated equation thus:

Where T = Transmissivity (m2/day)
The method for the transmissivity analysis of the studied area based on transmissivity index classification for identification of background transmissivity and anomalies is tabulated in Table 2. From the table, background transmissivity depicts the interval between (mean - standard deviation) and (mean + standard deviation) of the index transmissivity values. The positive and negative anomalies represent the groundwater prospective and less prospective zones respectively in relation to the background transmissivity. The extreme positive anomalies depicts zone of higher groundwater supply prospect due to high permeability while the extreme negative anomalies connotes the zone without groundwater supply prospect. The mean value and standard deviation of the logarithmic transmissivity index (Y) of Logo Area are obtained as 4.68 and 0.75 respectively. These values were used to analyze transmissivity based on logarithmic transmissivity index classification and result tabulated in Table 2.

Krasny Classification
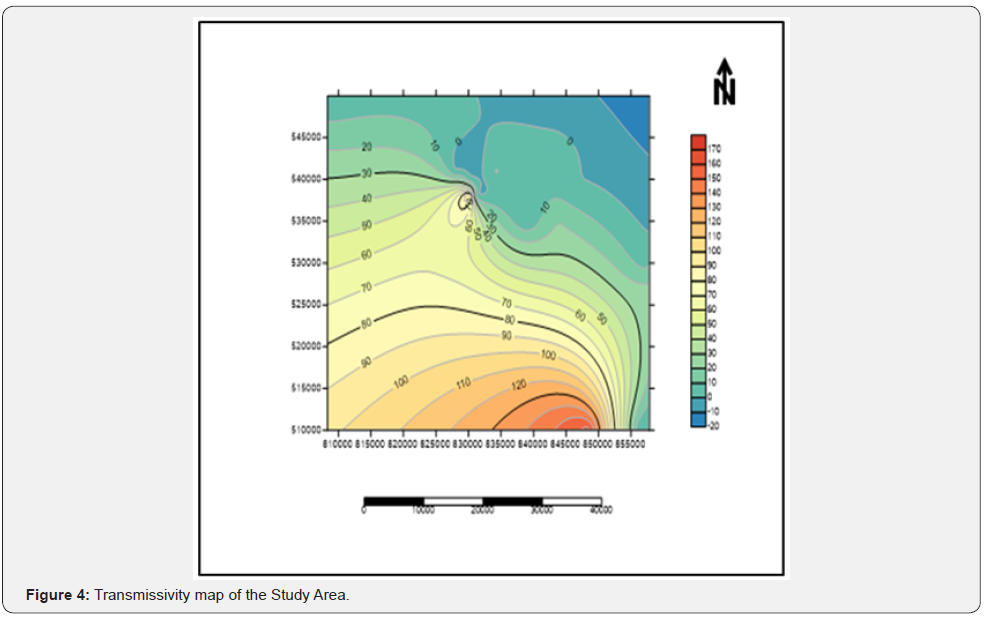
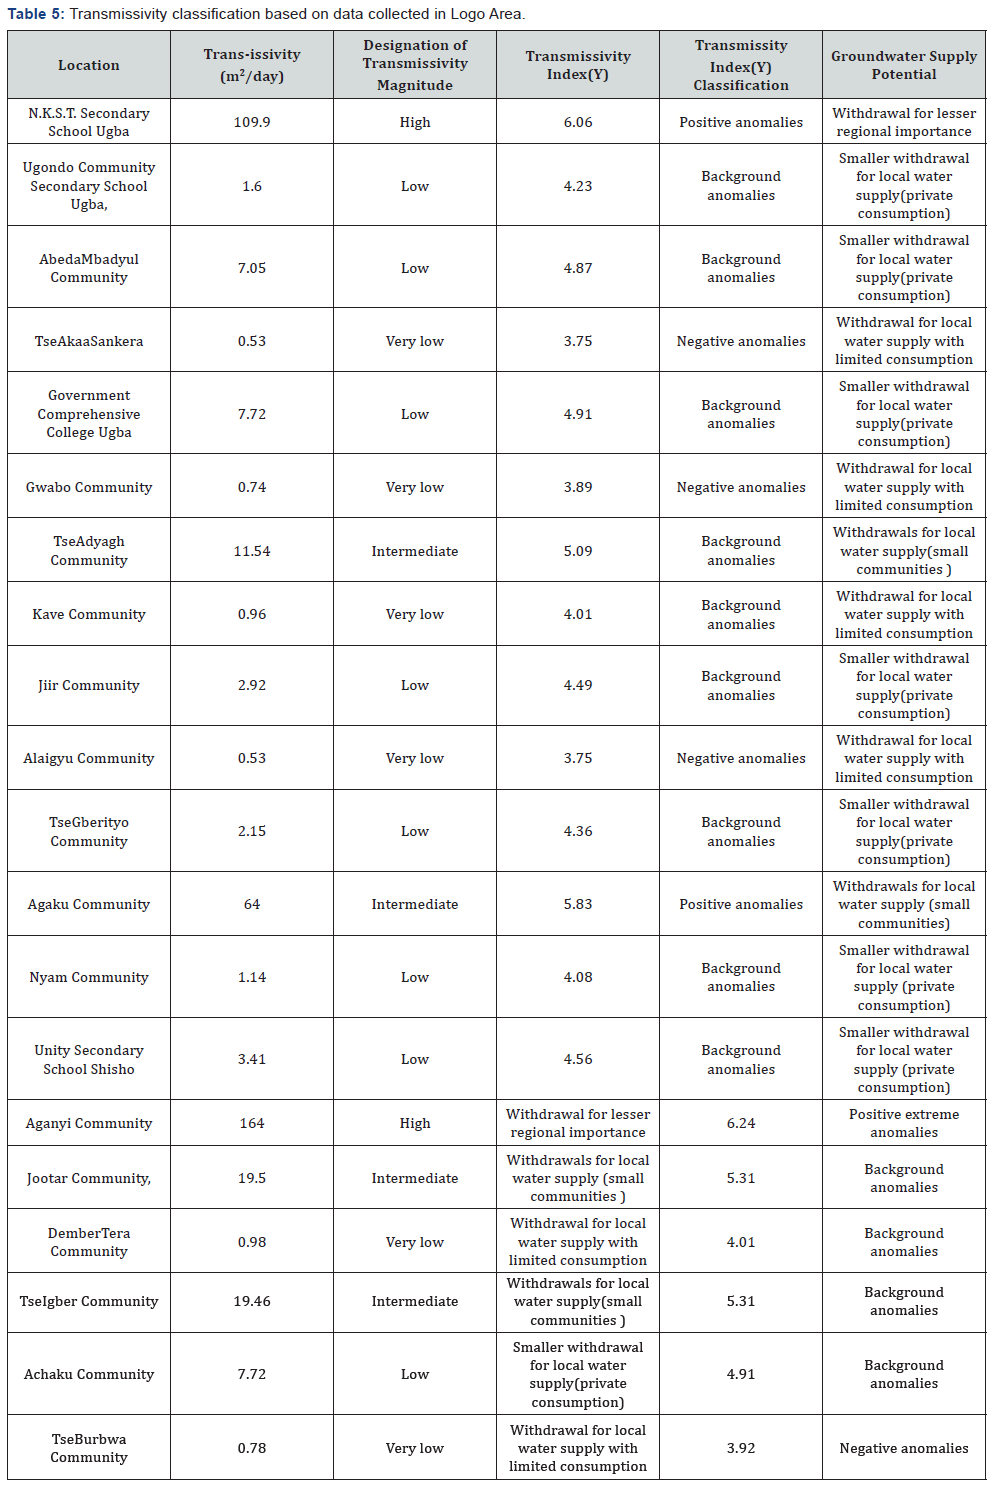
The classification of transmissivity and variation based on transmissivity magnitude and standard deviation of transmissivity index respectively were proposed by Jiri Krasny [10]. The classification methods for transmissivity magnitude and variation are in Tables 3 & 4 respectively. The standard deviation of the transmissivity index of the studied area indicates large transmissivity variation; this implies that the hydrogeological environment is considerably heterogeneous meaning that the aquiferous conditions vary over a short lateral distance (Table 5) (Figure 4) [11,12].

.

Conclusion
The transmissivity analysis reveals that the studied area is a considerably heterogeneous hydrogeological environment with about 65%, 20%, 10% and 5% of the sampled locations showing background, negative, positive and extreme positive anomalies respectively. The places like Agaku and Aganyi Communities and part of Ugha town (NKST Secondary School Ugba) have high groundwater supply potential and are suitable to site community water scheme due to their high transmissivity values. In addition, places like Abeda Mbadyul, Jiir, TseGberityo and Nyam communities with background transmissivity have groundwater supply potential for private consumption, whereas places like TseAkaa Sankera, Gwabo, Kave, Alaigyu, Dember Tera and Burbwa Communities have groundwater supply potential for limited use.
To know more about Juniper Publishers please click on: https://juniperpublishers.com/manuscript-guidelines.php
For more articles in Open Access Journal of Environmental Sciences & Natural Resources please click on: https://juniperpublishers.com/ijesnr/index.php




Comments
Post a Comment